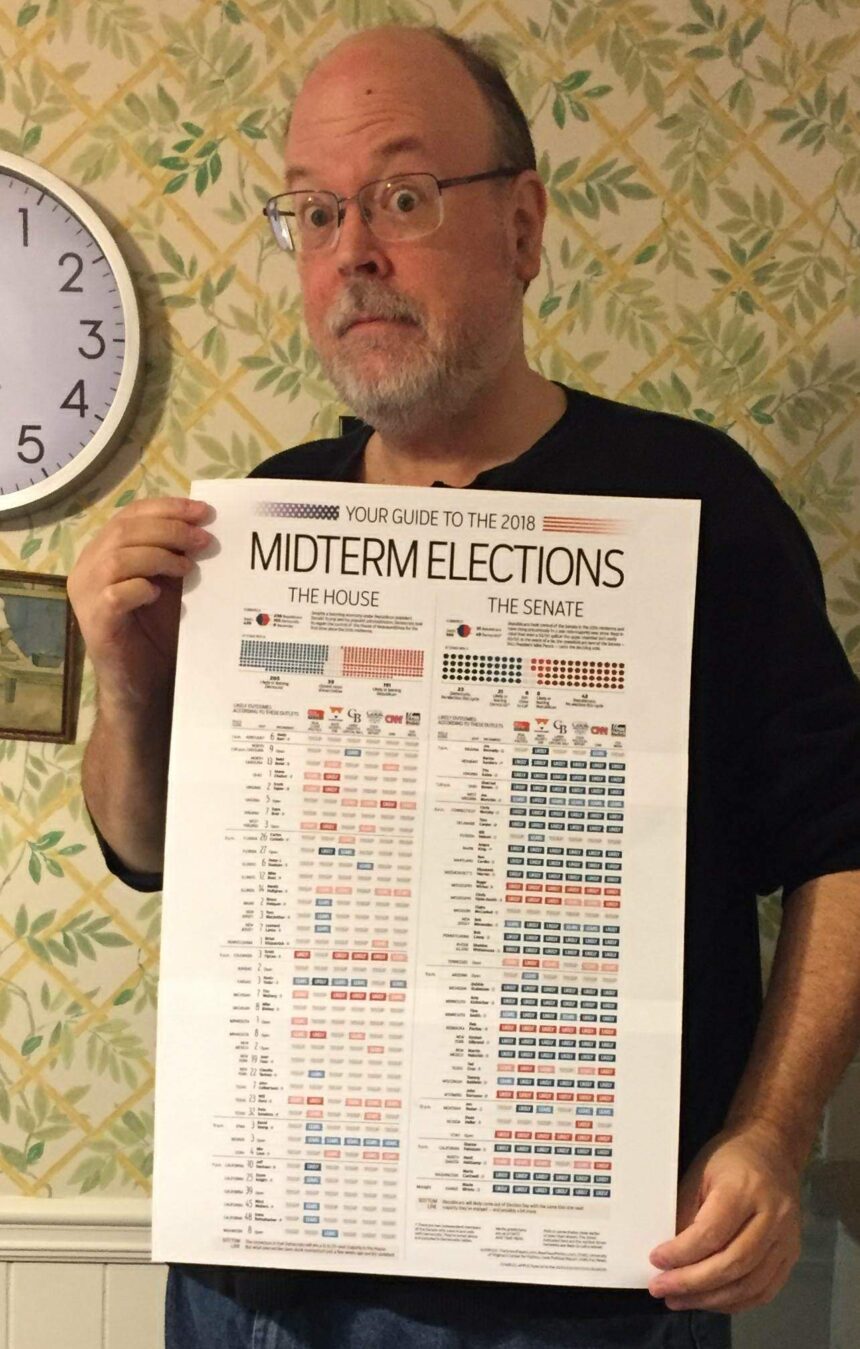
Well-known infographic specialist Charles Apple of US wrote exclusively for www.newspaperdesign.in on how he successfully made election graphics from 2000 to 2018
The origin of this project goes way back to the presidential election of 2000 — that’s the one that featured Al Gore vs. George W. Bush.
I proposed a graphic for my paper at the time — the Des Moines Register — that would pull together all the major news outlet predictions of who would carry which state and who might win. I listed the Associated Press, New York Times, Washington Post, USA Today, CNN, Fox News and so on.
Part of the problem with an ambitious idea like this: It can be a LOT of work. And in the middle of election season, a newspaper’s political reporters just don’t have time to compile information like this. But my own college minor was in Political Science. I can wrap my head around this stuff. So here’s my real advantage: I offer to research, write and design the entire project myself. This takes the burden off of our reporters and editors.
I might also add: Aggregating all this material can be mighty tedious. But that’s part of the job for a good graphic journalist: Make the tedious interesting; find the important parts and make them more obvious to the reader.
[ 2000 VERSION ]
So the 2000 graphic went over very well. Four years later, I did it again at my next paper, the Virginian-Pilot. Again, the graphic worked well and was well-received. Two years after that, I did a version for the 2006 Midterms that looked at control of Congress. And, again, that came out great.
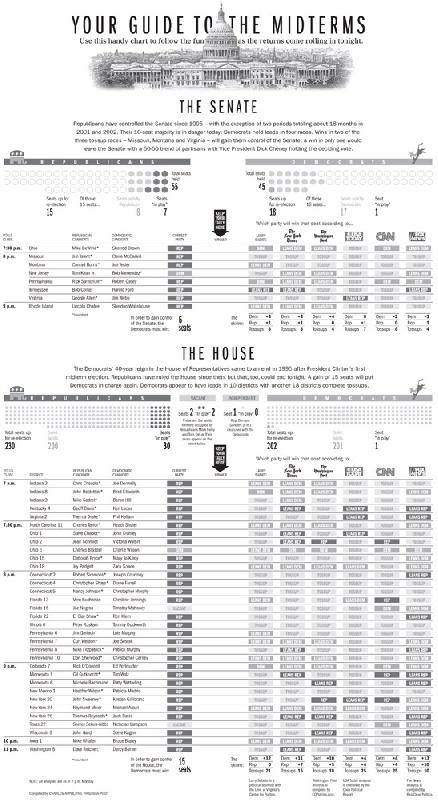
[ 2006 VERSION ]
In 2008, however, I found myself out of work for the first time in my career during a presidential election. On a bit of a whim — and because I had nothing better to do — I built my presidential graphic and offered it to every newspaper editor I could think of around the country.
That met with great success. I ended up selling that graphic to 14 newspapers.
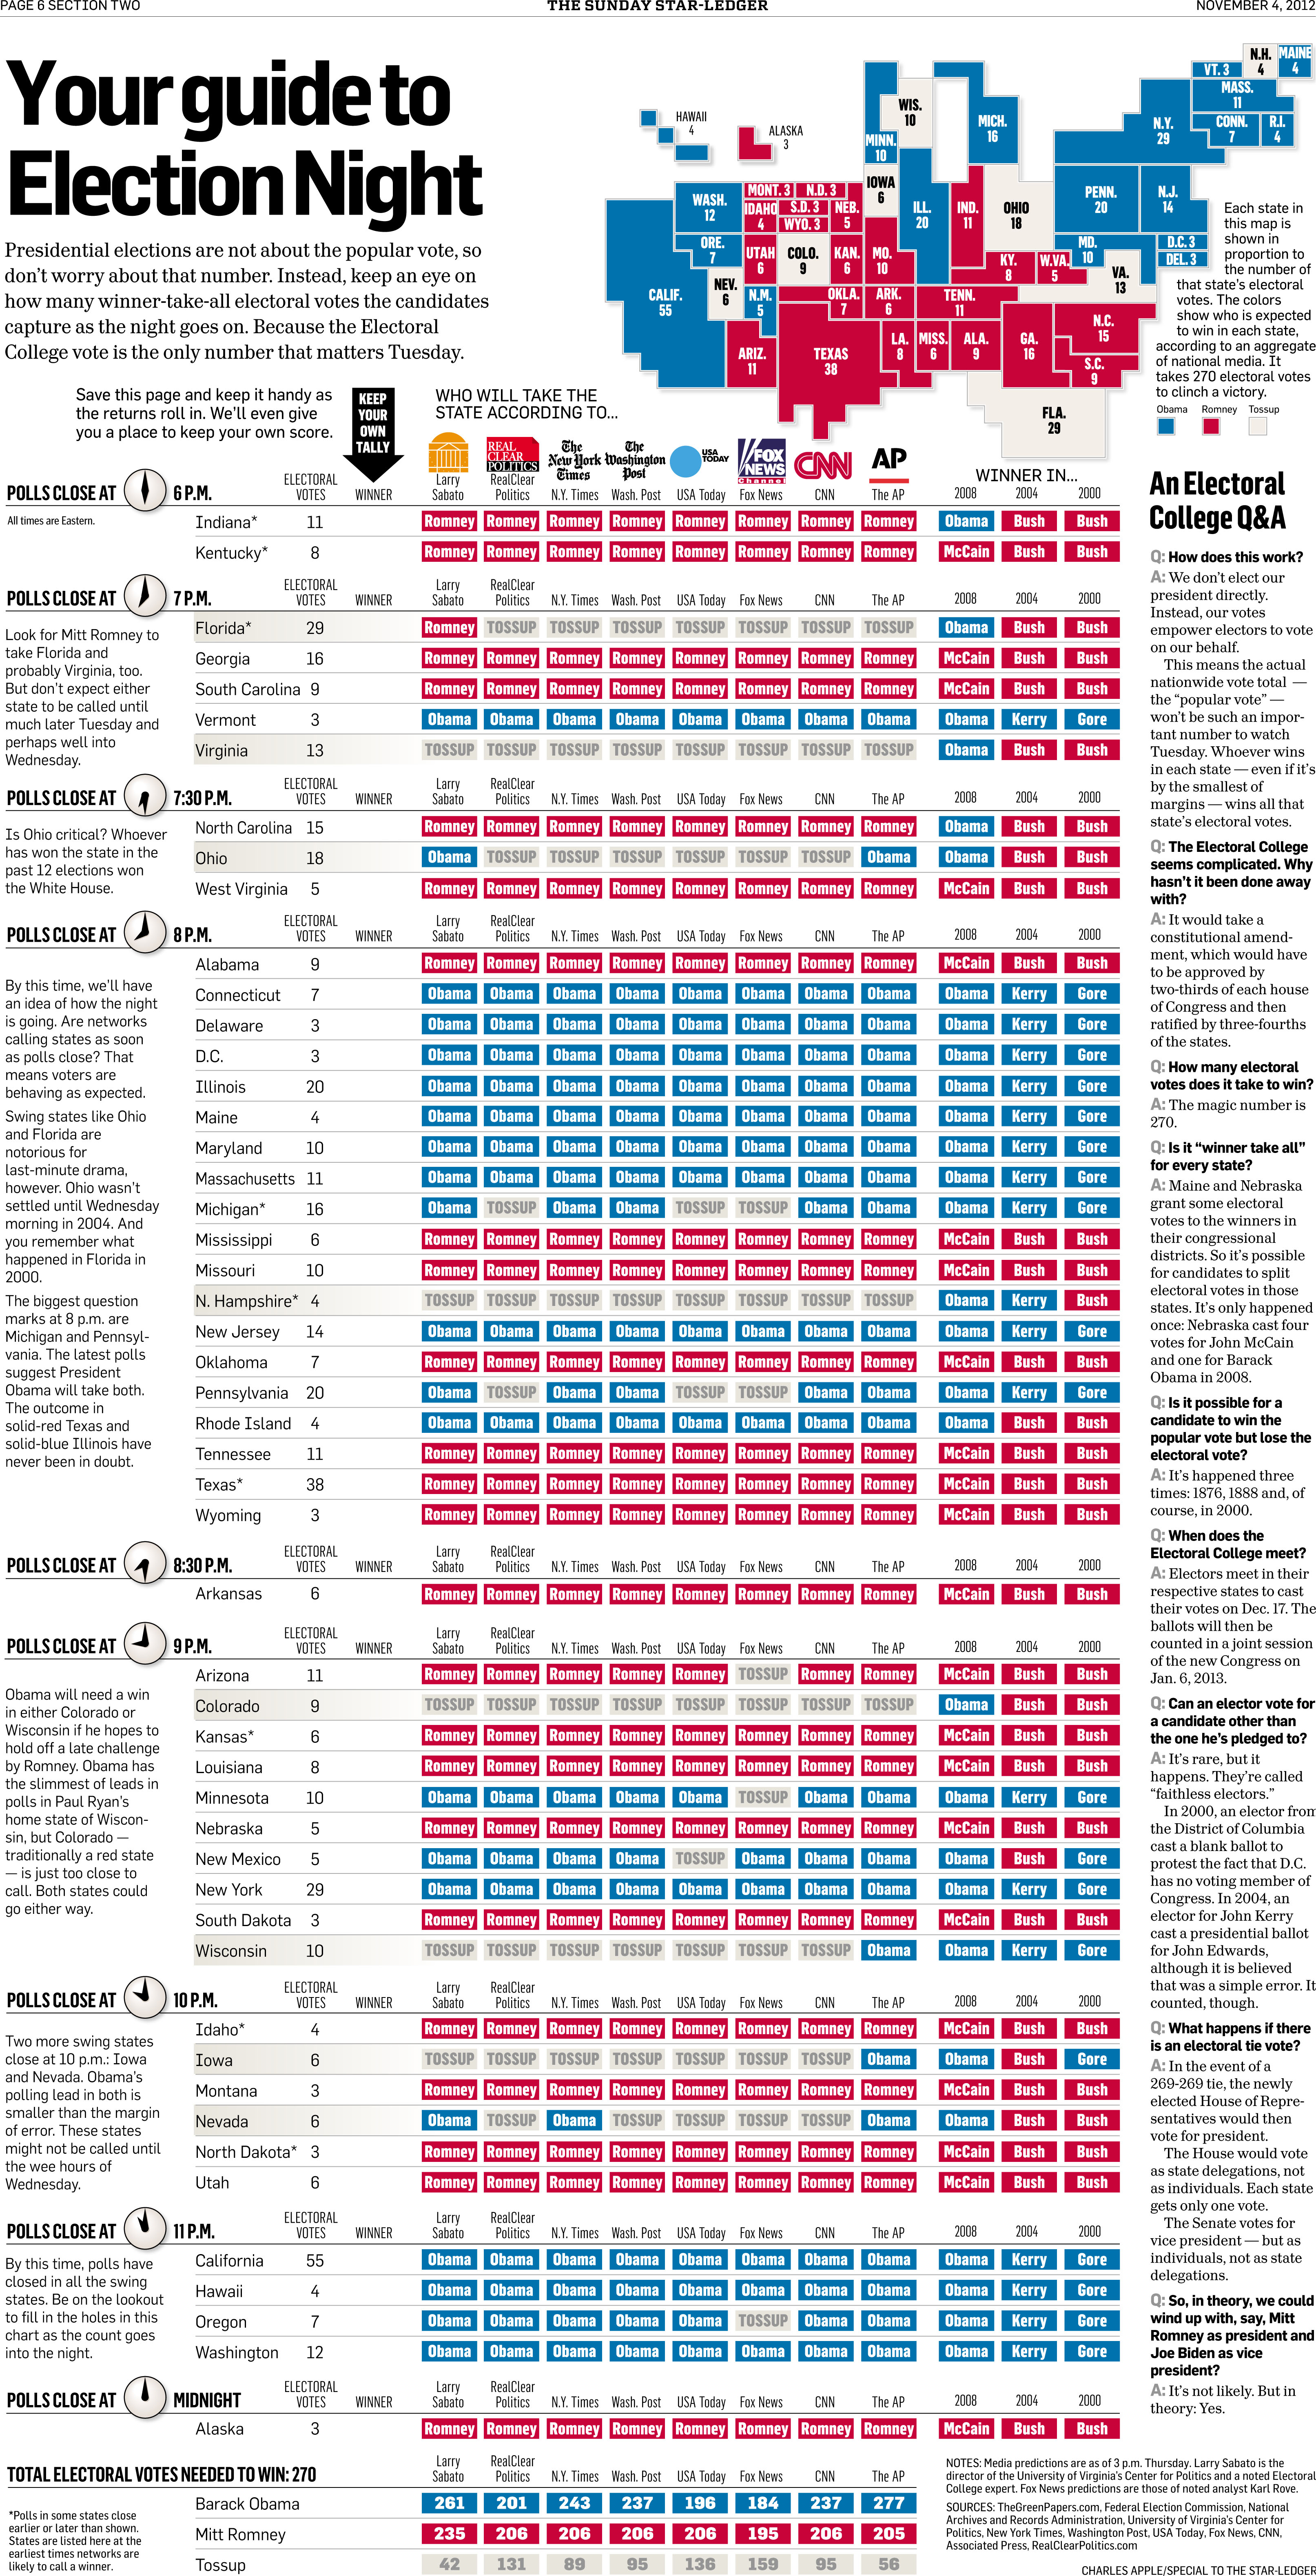
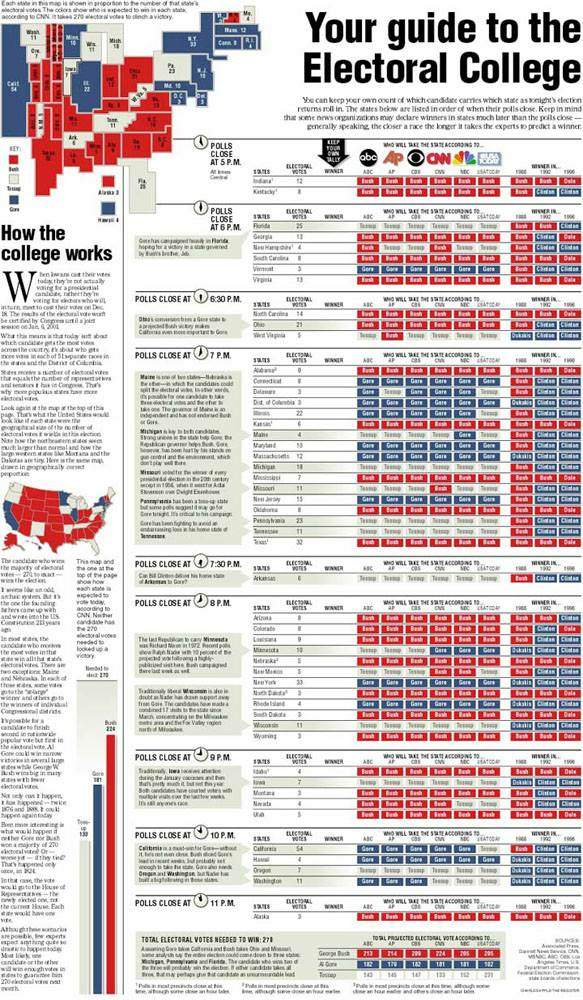
[ 2012 VERSION ]
In 2012, I did it again — and I really poured on extra effort, contacting editors I had met in my five years of speaking and consulting work. That time, I managed to place my graphic in 36 newspapers, including a couple of newspaper groups that bought it for all their papers.
In 2014, I was at the Orange County Register and in charge of their Focus pages. I built a number of Midterm graphics for them.
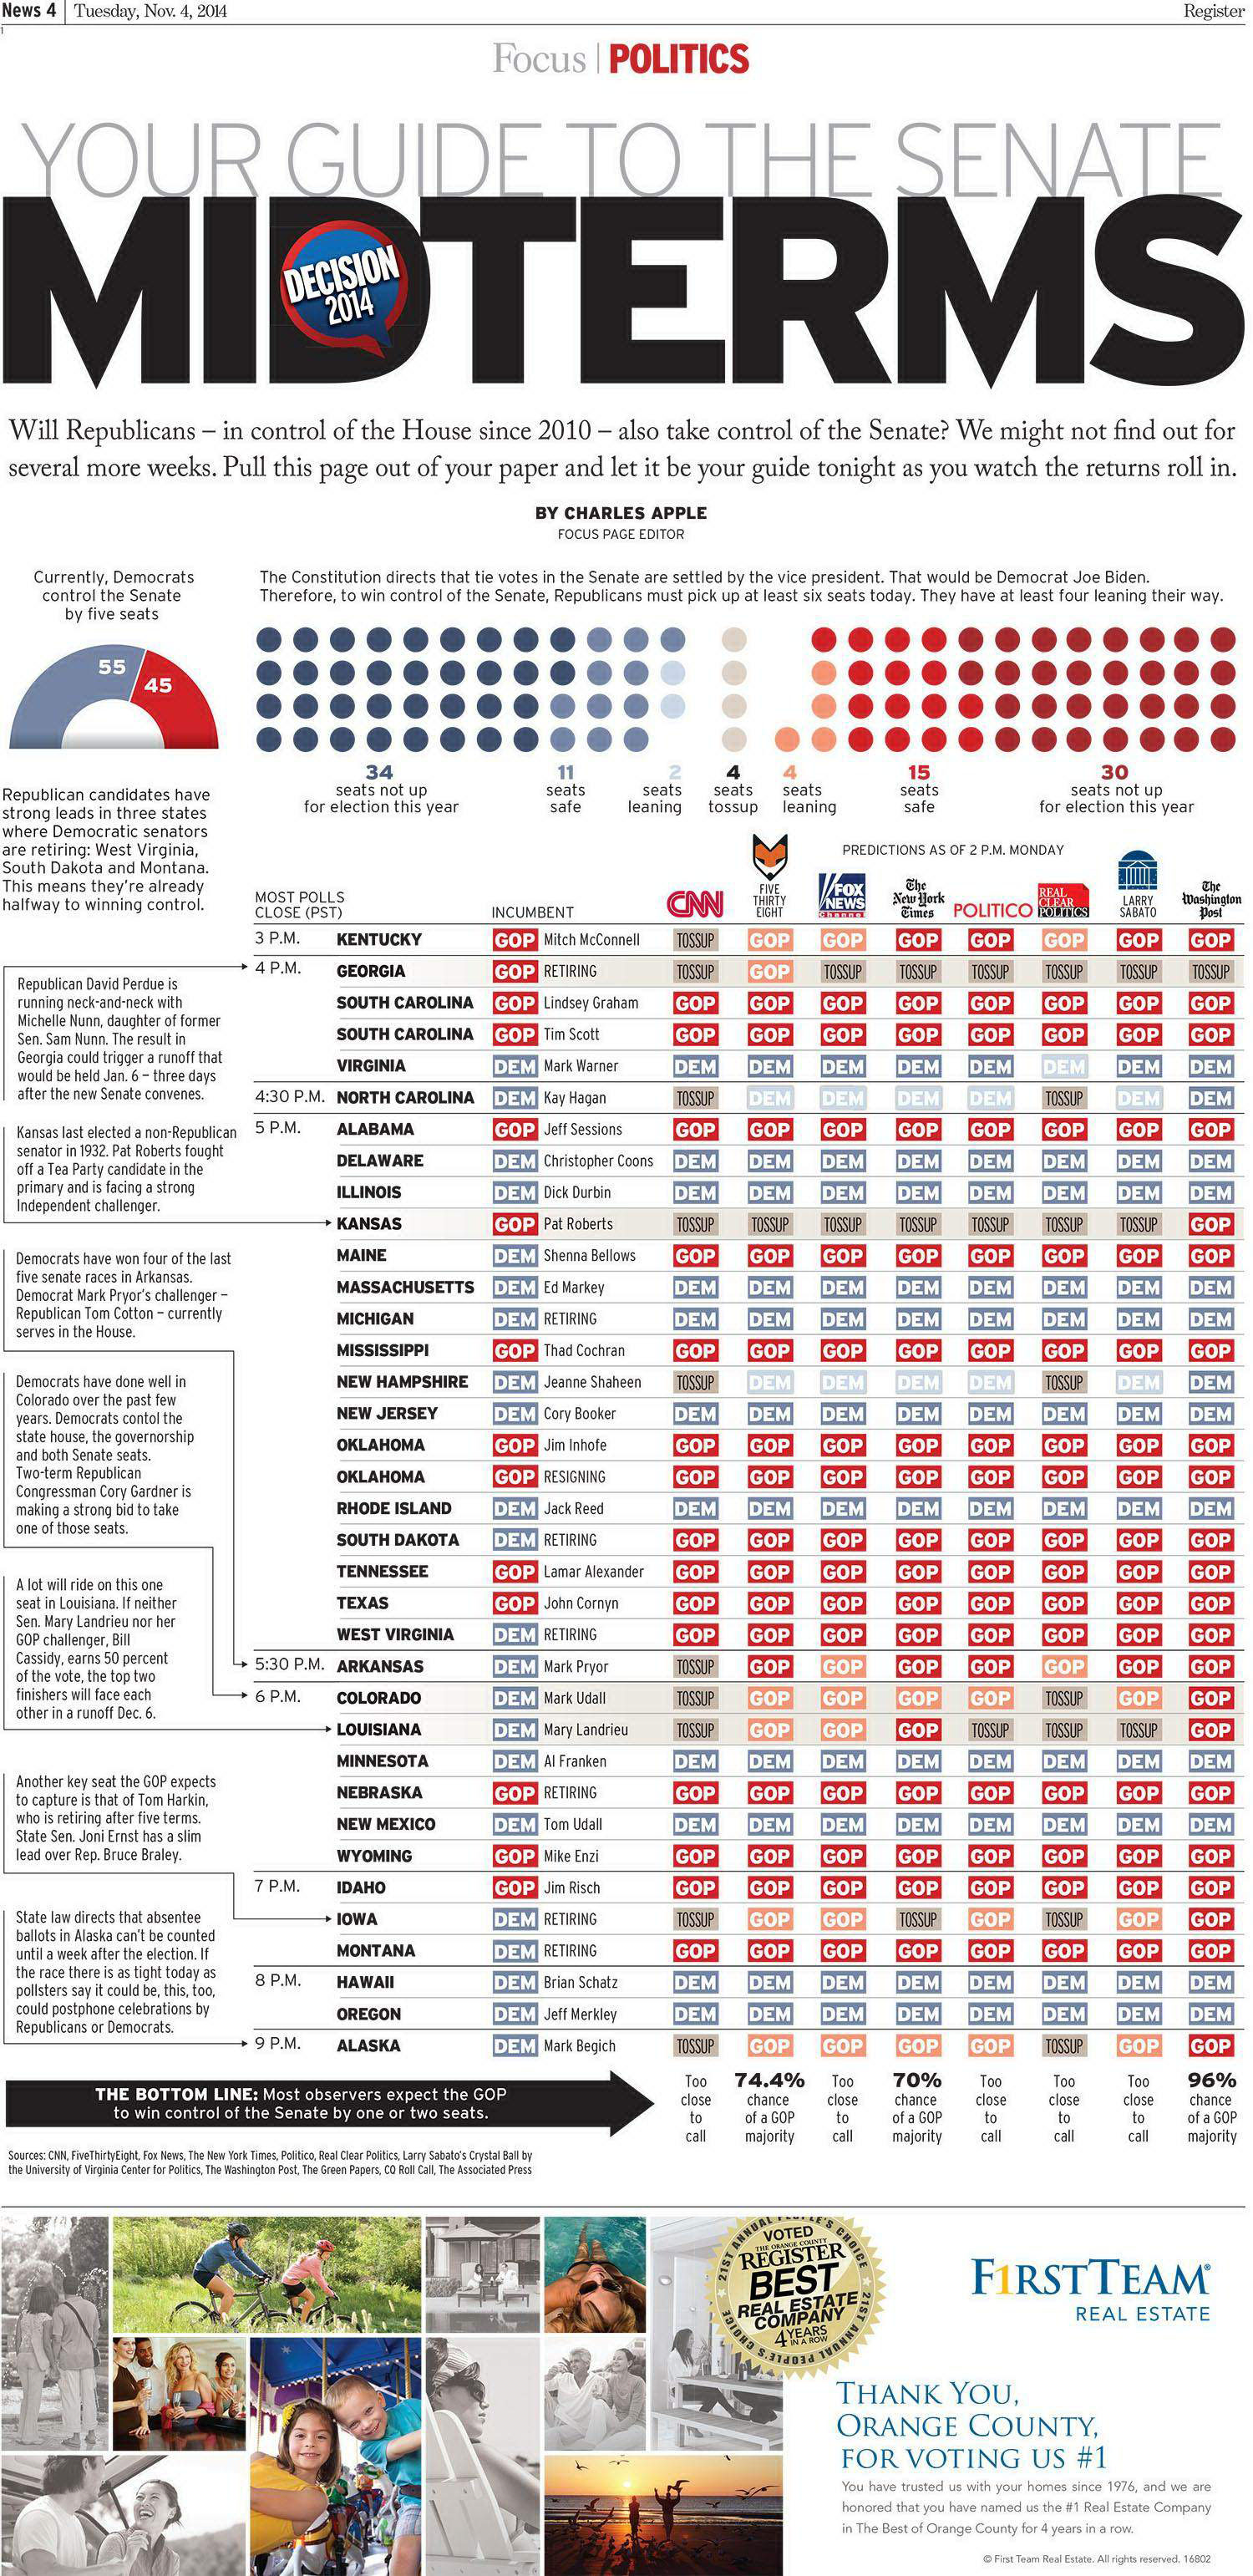
[ 2014 VERSION]
In 2016, I did a smaller version of my presidential graphic for my paper at the time, the Houston Chronicle.
So I’ve been doing this sort of thing for a long, long time. And I pretty much have the process down.
In September, the Chronicle eliminated my position, leaving me out of work again. With this year’s Midterm elections contentious — to say the least — I figured it was time to pull this idea out once again.
The big difference these days are which media outlets to show. The New York Times, for example: The guy who did most of their poll analyses and political predictions was Nate Silver. He left the Times several years ago and now runs his own web site: FiveThirtyEight. I most definitely use his material. Meanwhile, the Times now outsources that work to the Cook Political Report. So I use them. I also include Larry Sabato of the University of Virginia. And I use my own favorite, RealClearPolitics.com.
The only two “traditional” media outlets still in my data grid: CNN and Fox News.
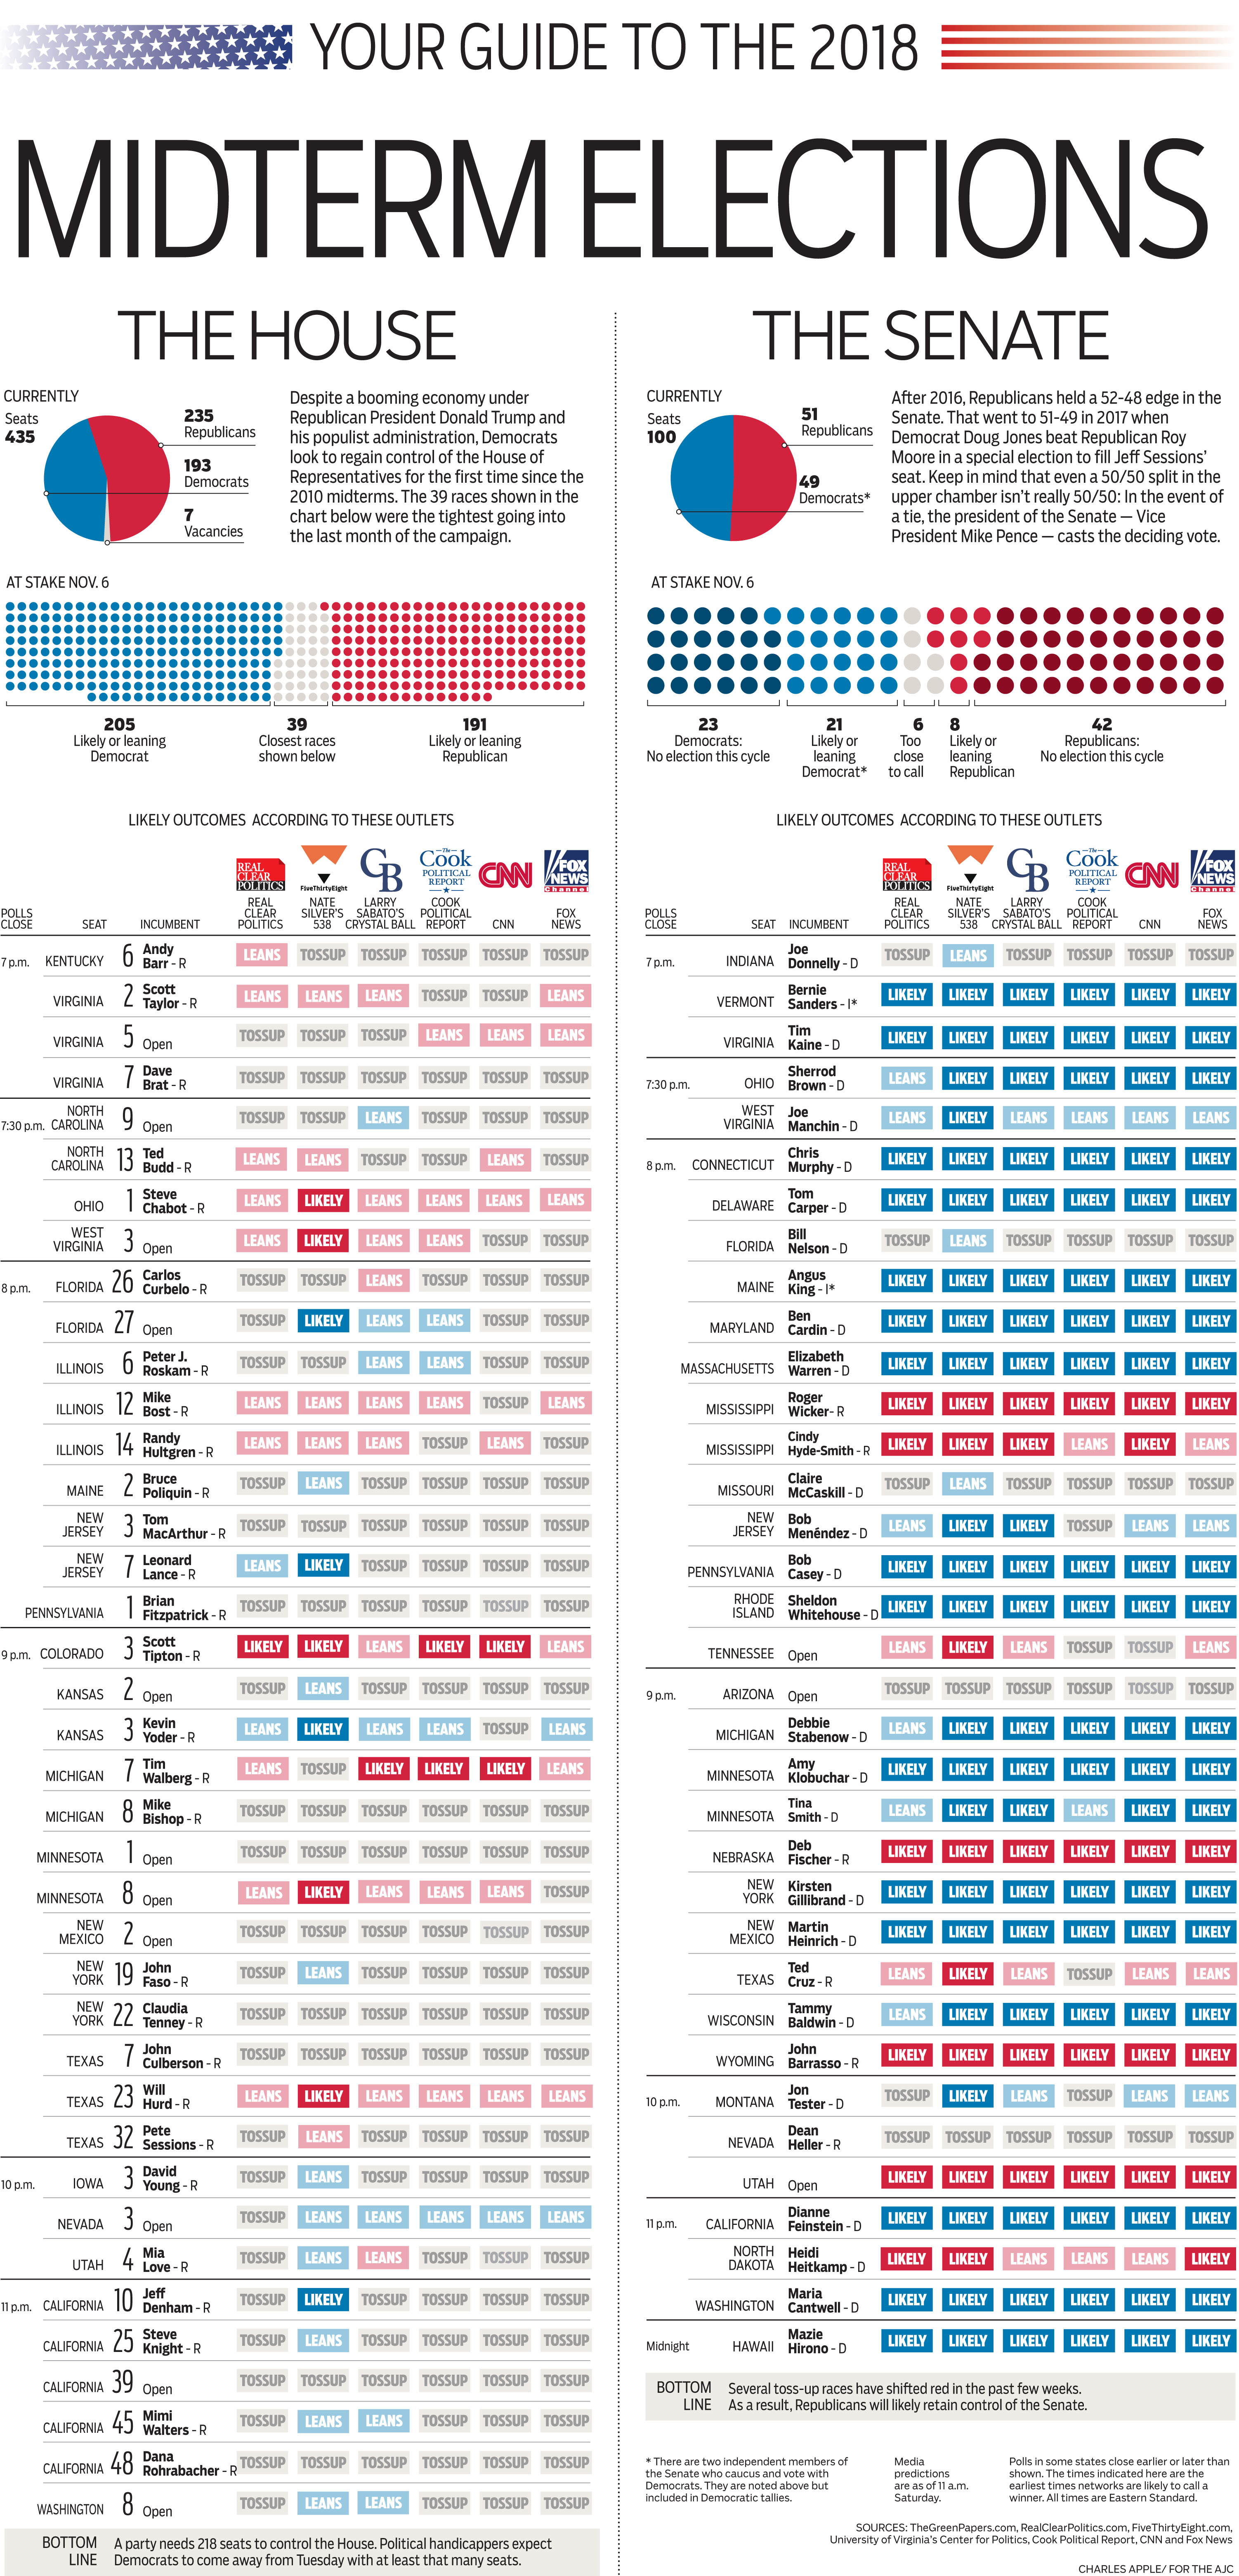
[ 2018 VERSION ]
I began planning about three weeks out. I built an early version of the graphic and then sent JPGs to editors around the country. I have a sliding fee that I charge: Larger papers pay a little more and smaller papers a little less. I offer to build for each paper’s page size dimensions and to use their fonts. And I promise to get them a copy early enough for them to copy-edit, but also to send them an updated copy with the latest data possible.
The idea is to make it as easy for them as I can. Editors usually tell me they like the graphic. When they say “no,” it’s usually because they can’t get the space. Space is awfully tight in U.S. newspapers these days.
Once I sign up some clients, I go back and update the data in the graphic. With a few days to go, I “split” the graphic into the various versions I’ll send out. Once I do that, every little data update has to be done multiple times. And that gets awfully time-consuming.
Making all this more complicated: I relocated from Houston to Atlanta during all this. I haven’t had time to set up a home office just yet. So I did all this work spread out on the kitchen table. Meaning that I had to clear everything away whenever it was time to eat.
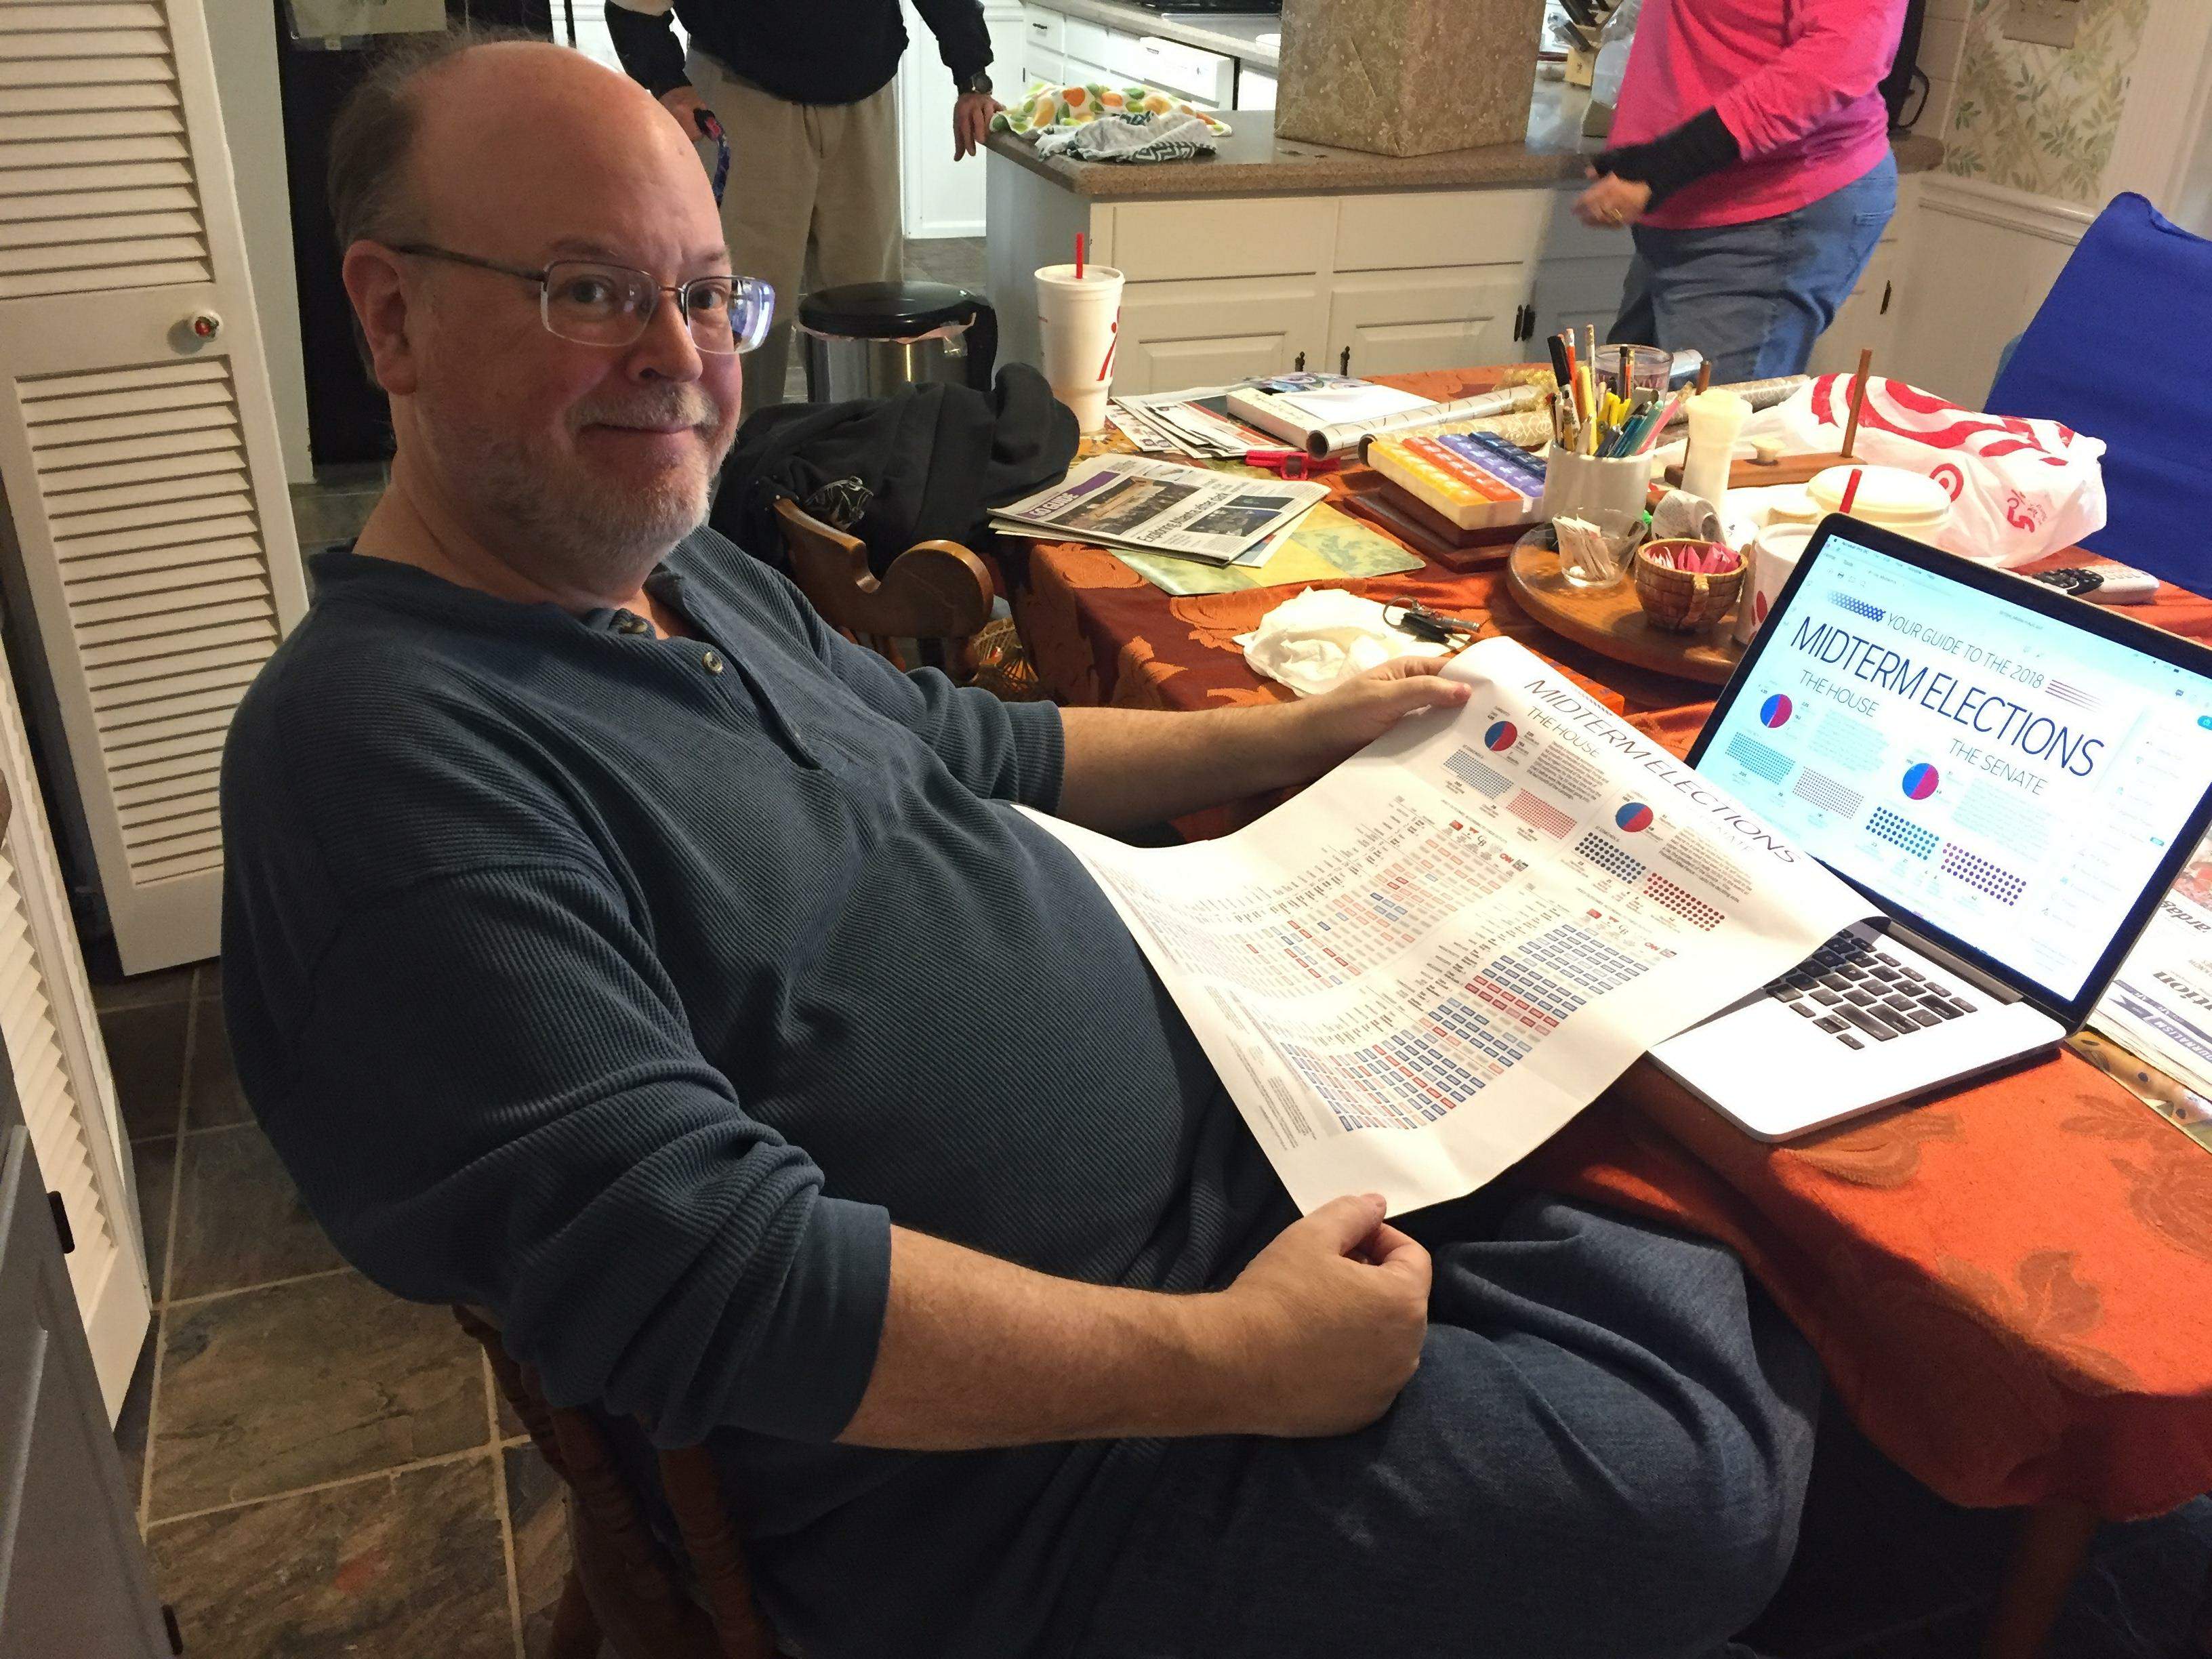
Charles Apple
But I managed to get all my final copies sent out Friday and Saturday. One newspaper — the Spokane, Wash., Spokesman-Review — use the graphic on Saturday. Most of my clients used the graphic on Sunday. One wants to use it on Tuesday, so I’ll update it once again Monday and send him another copy then.This year, I managed to sell the graphic to:
Houston Chronicle
San Antonio Express-News
Atlanta Journal-Constitution
Las Vegas Review-Journal
Spokane (Wash.) Spokesman-Review
Beaumont (Texas) Enterprise
Berkshire (Mass.) Eagle
Greenwood (S.C.) Index-Journal
Jackson County (Ala.) Sentinel
In addition, two newspaper groups bought the paper to use in all its papers:
Fargo (N.D.) Forum newspapers
Digital First’s Southern California News Group and Bay Area News Group.
The Forum group consists of 8 dailies. The SCNG and BANG consists of 11 dailies, last I saw.
So unless my count is off, that’s 27 newspapers that ran my graphic this weekend or over the next few days.
I’ve been contacted by a few newspapers to do some more freelance work. But my real hope is to write a book — a book heavy on graphic explanations. My hope is to get that out by this time next year.
![]()