
By Ferran Morales
Senior infographics specialist at Mundo Deportivo
We released various visuals of the Qatar World Cup Soccer in Mundo Deportivo during the months of November and December 2022. We’ll examine some of the print and digital art in the sections below.
We collaborated with Vanesa Mauri, head of infographics, Hugo Navarro, Roger Guillamet, Ainhoa Campaa and myself in the graphics department. The editors of the graphics section and the soccer section collaborated closely to provide our viewers with high-quality content for the World Cup.
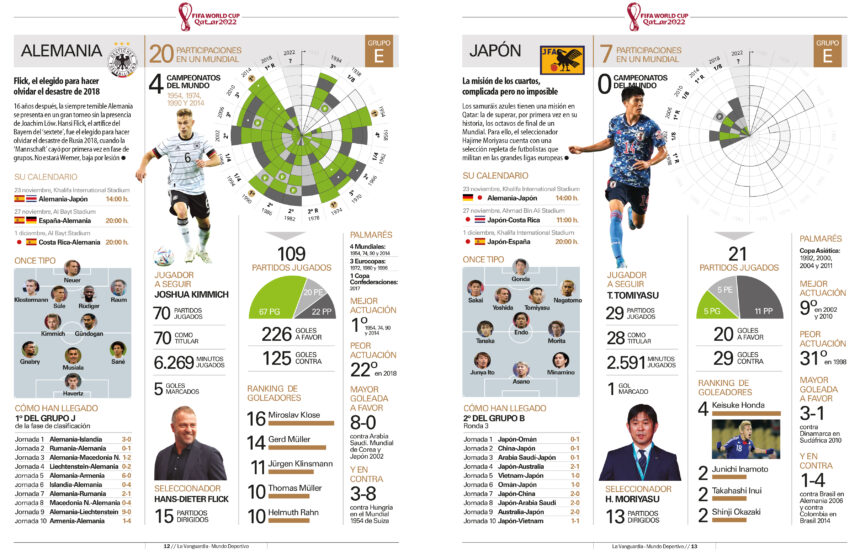
A few days prior to the beginning of the World Cup , we issued a special in which we thoroughly examined each of the 32 competing teams using the most pertinent data from the competition. This special was created along with the editors of Mundo Deportivo and La Vanguardia.
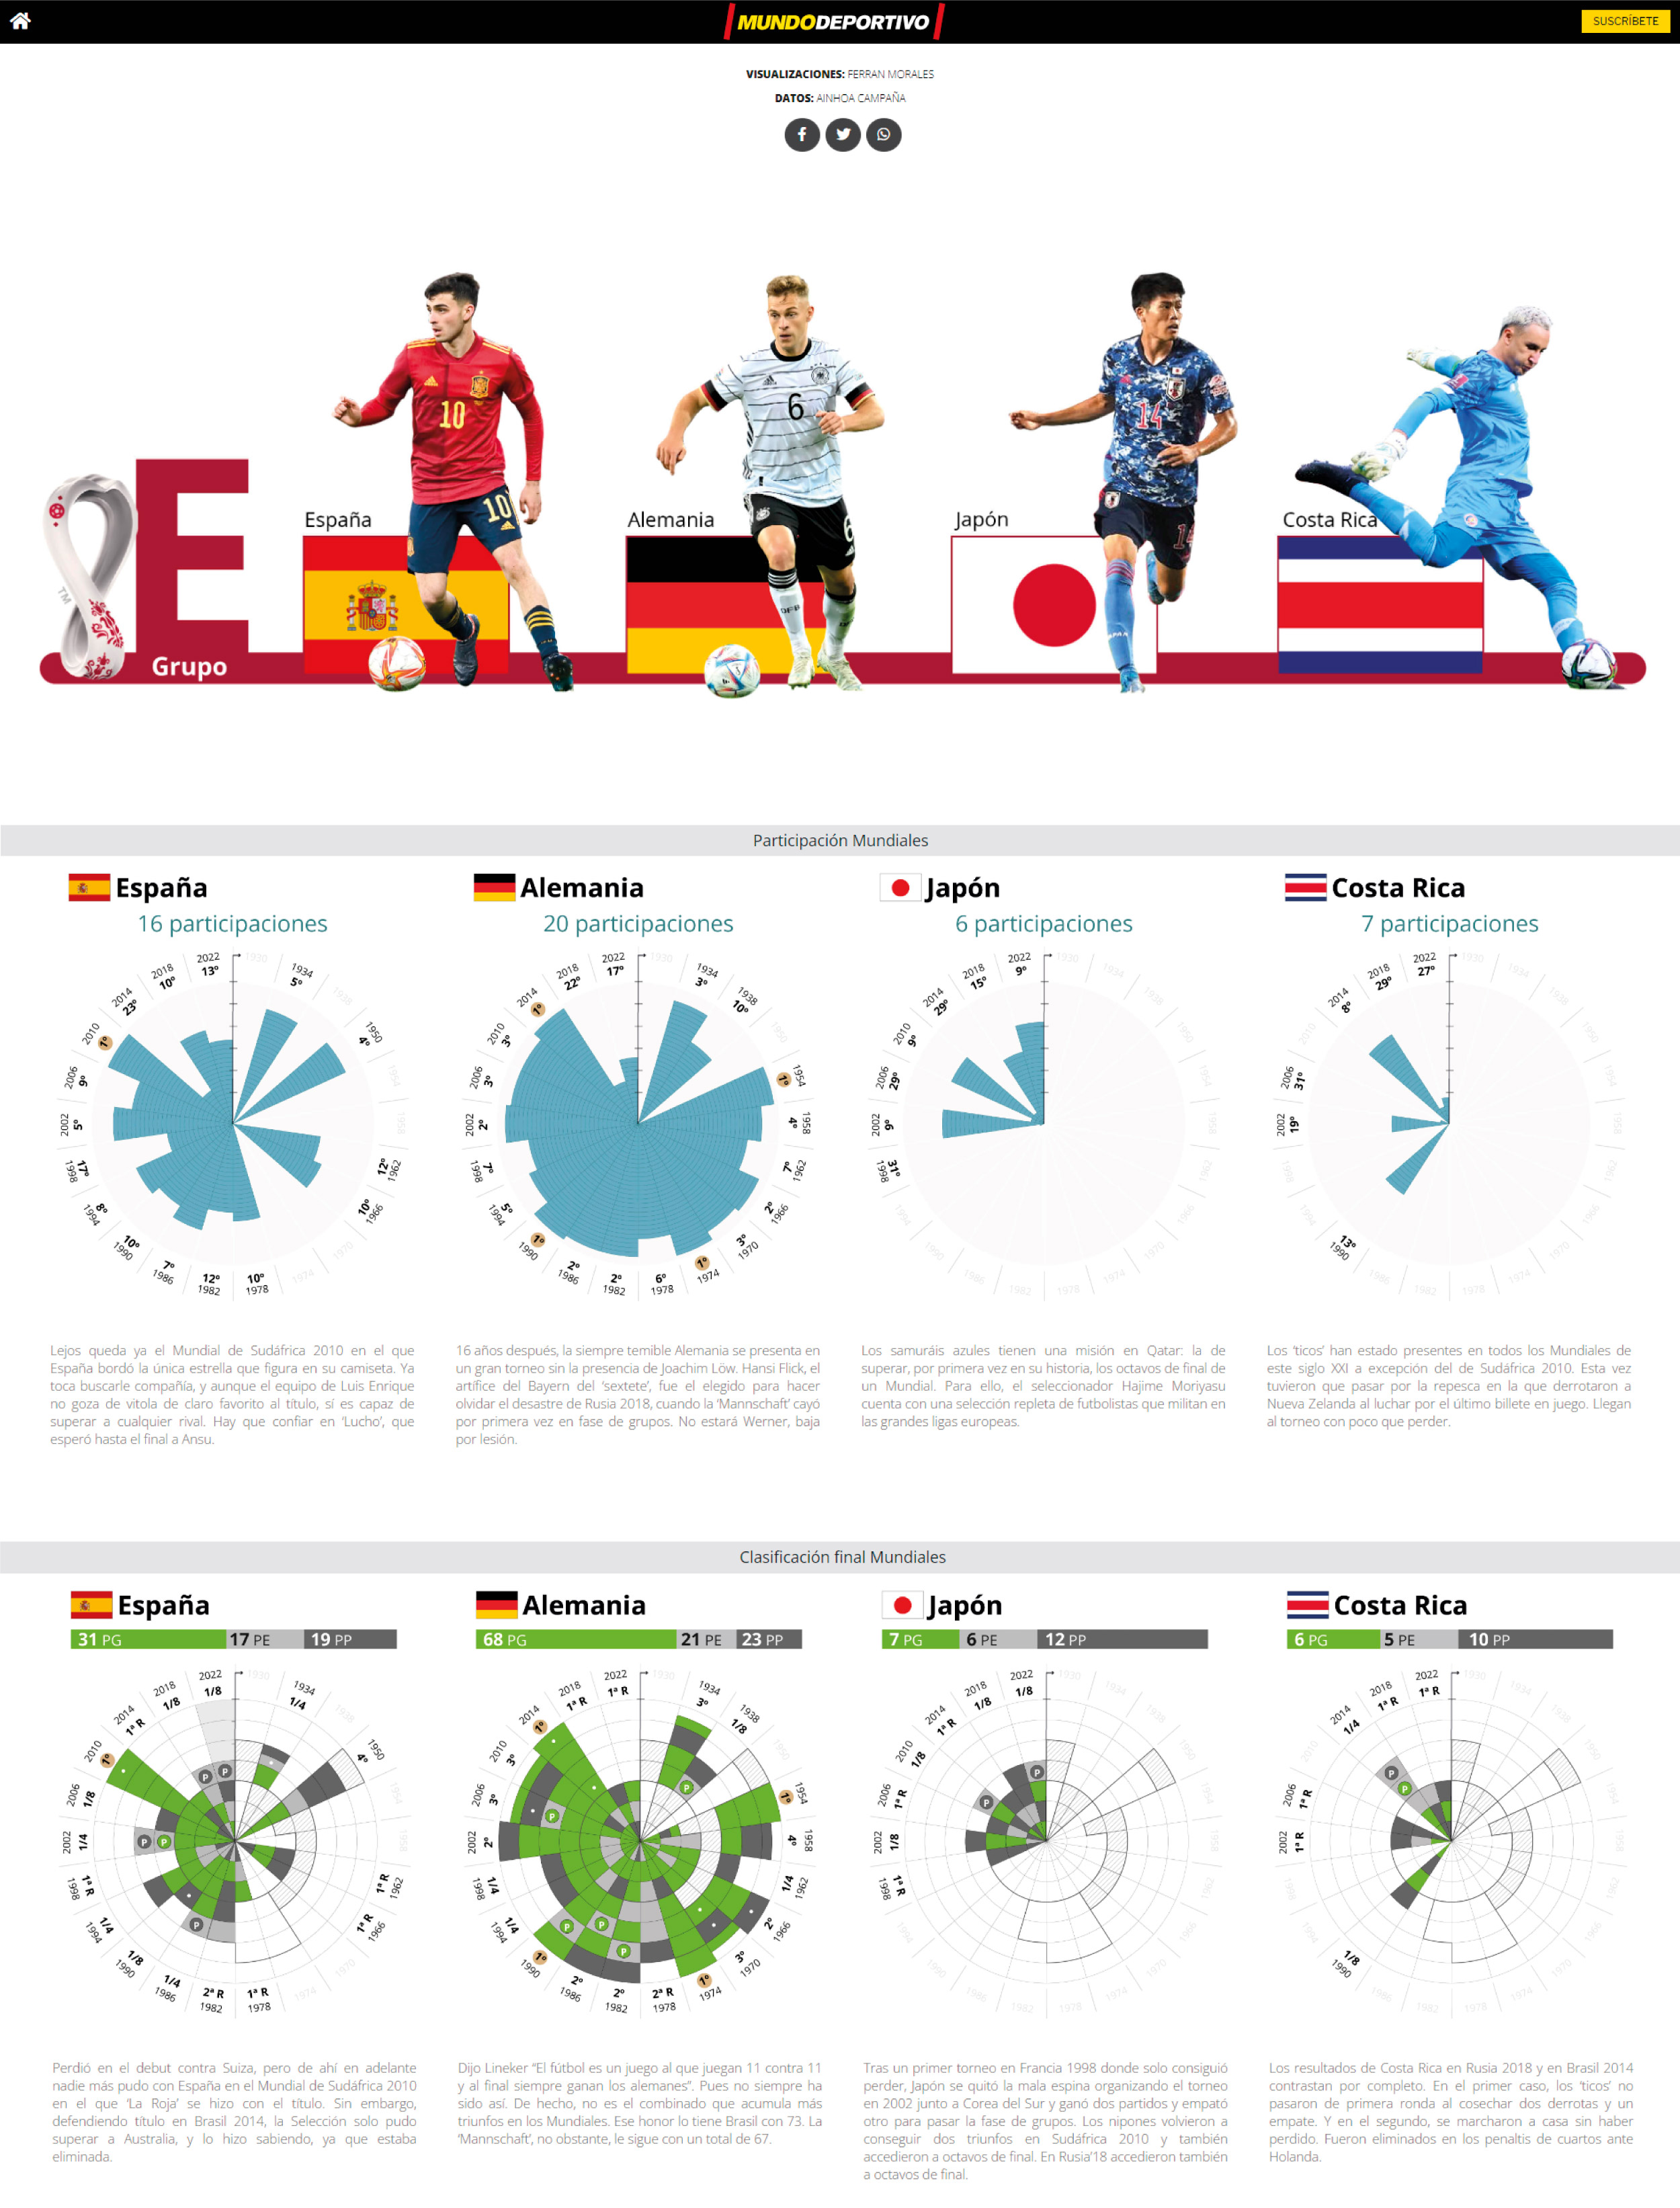
During the opening ceremony, we released a digital special, exploring the backgrounds of the teams competing in the World Cup in Qatar, breaking them down into the eight groups.
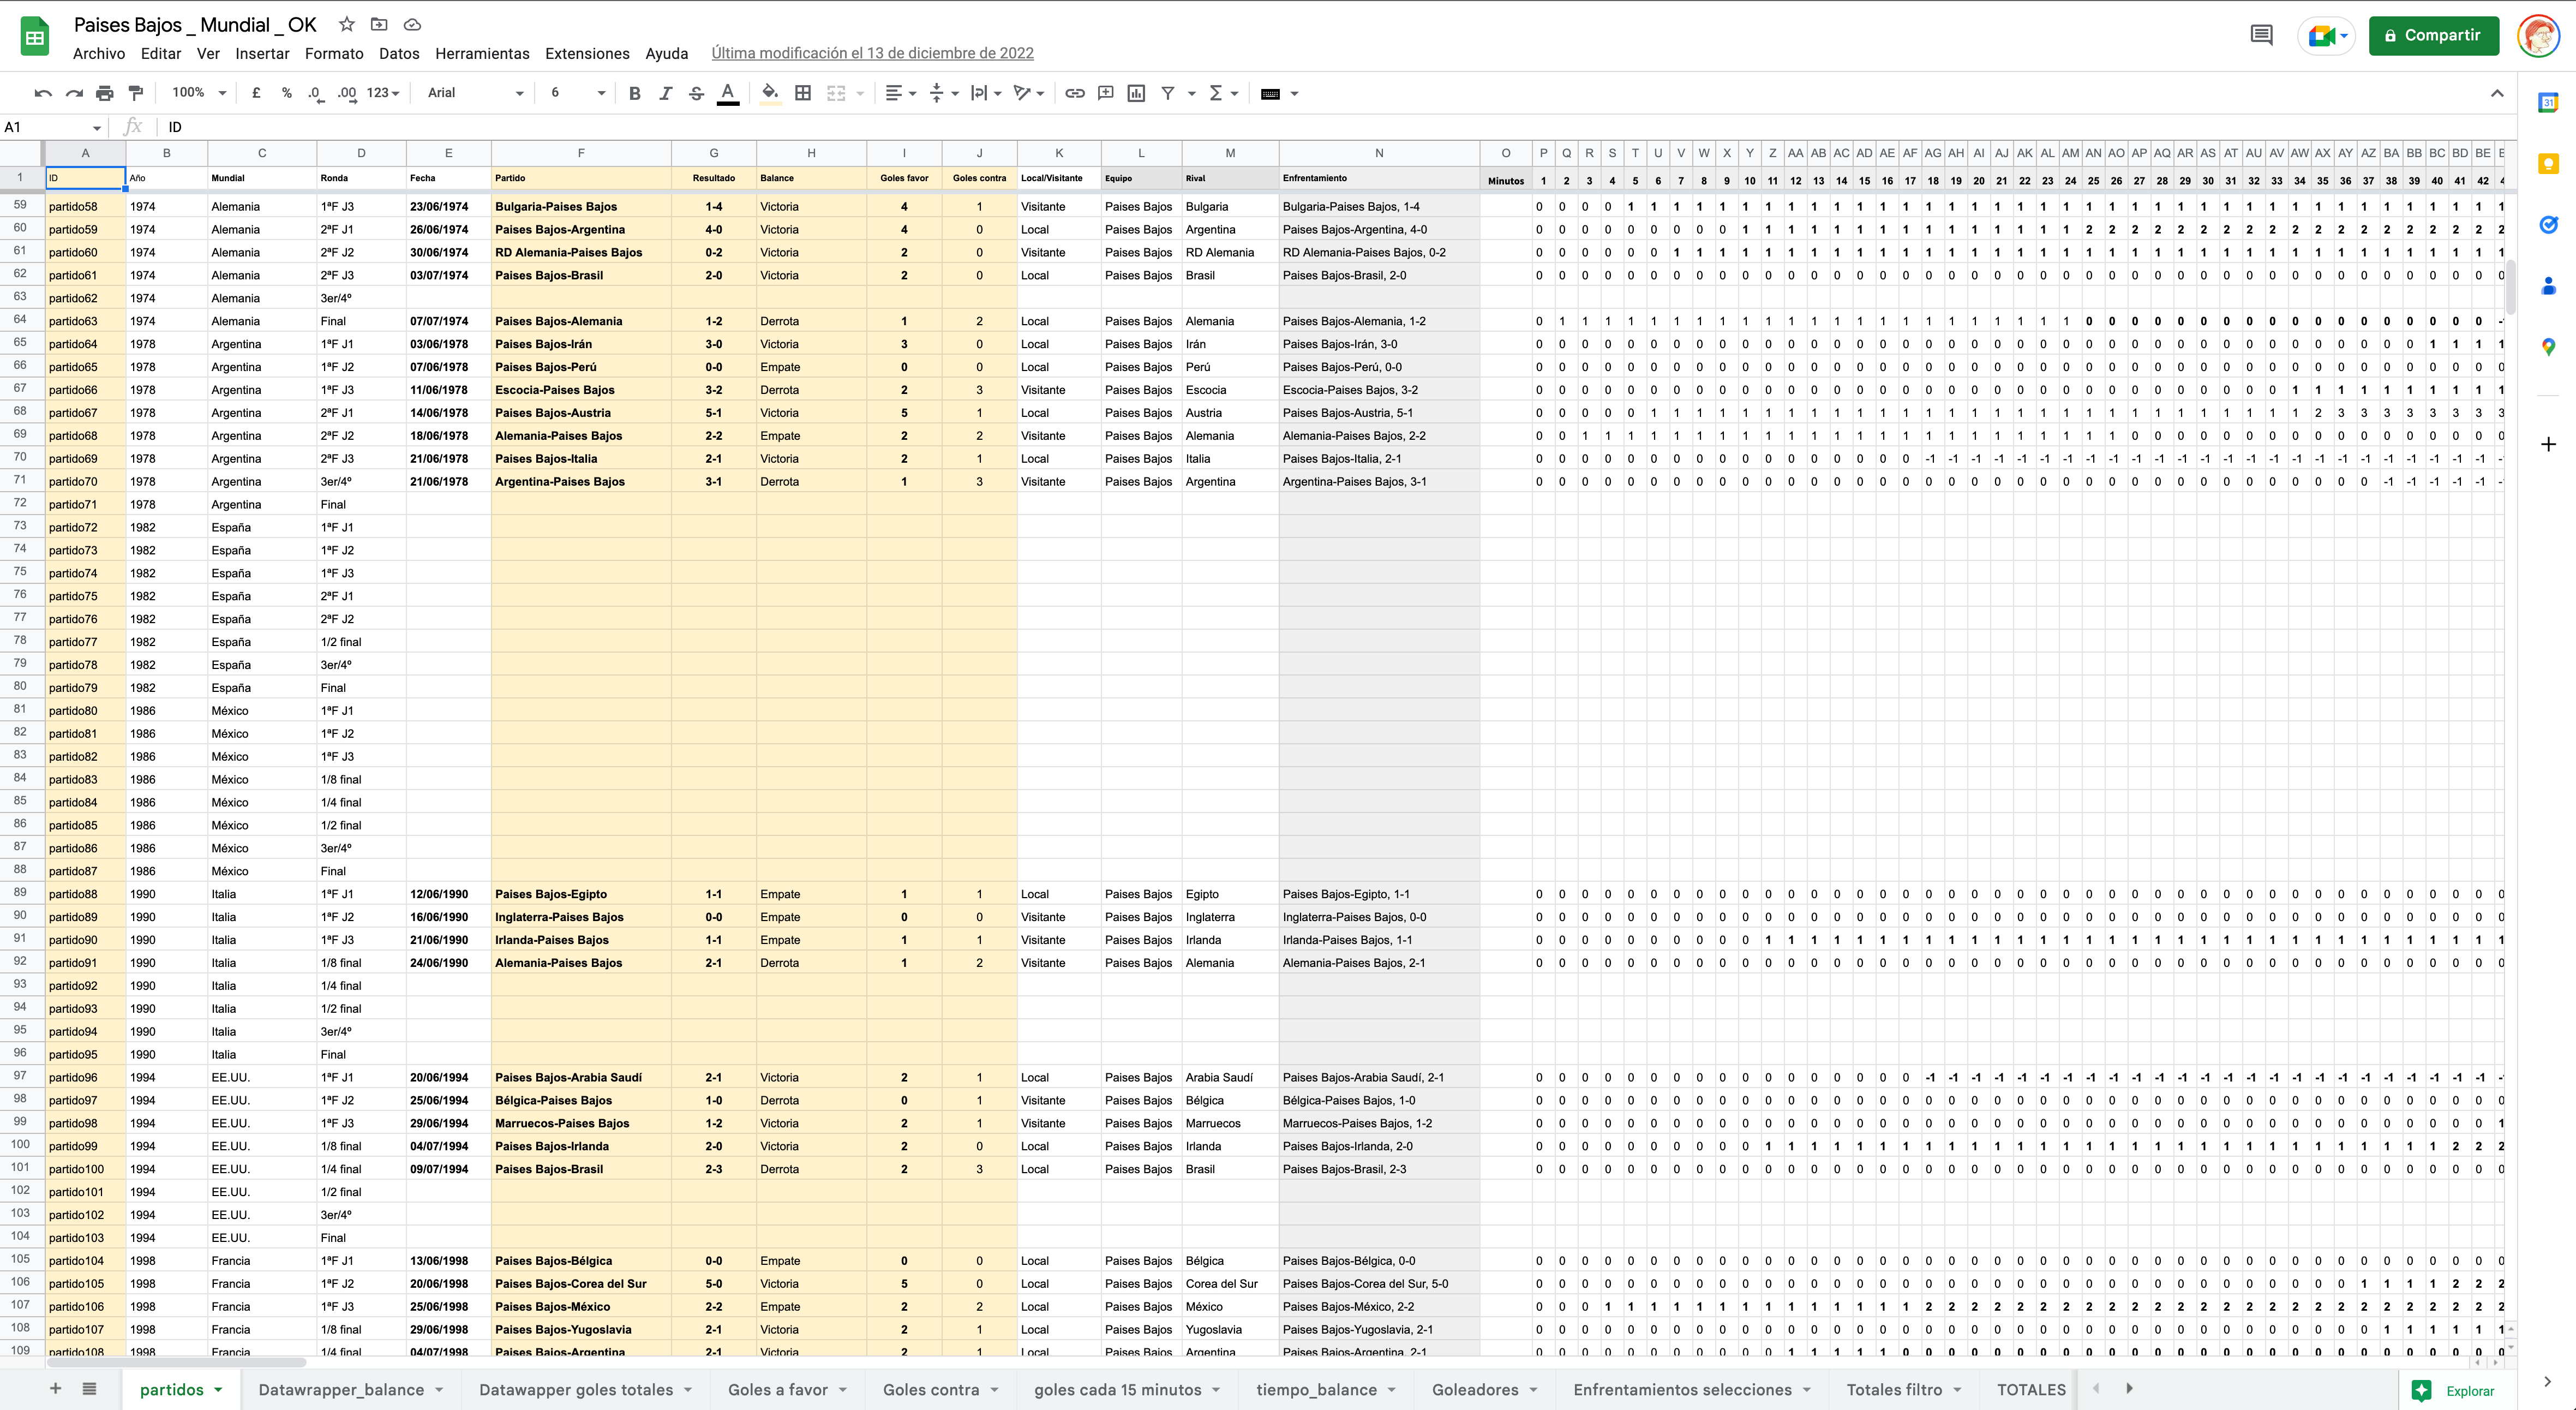
We consulted three sources in order to gather reliable and confirmed data: our own sources, the FIFA Archives, the Rec.Sport, Soccer Statistics Foundation, and the World Cups of Football. The ability to produce engaging and accurate tales about World Cups depends on the collection of data, which is a difficult and time-consuming procedure. We gathered and filtered data using the Google site.
Creating a structure
We felt it was crucial that the data from the several teams competing in each category could be easily shown and compared. To make it easier for the reader to understand it, during the special’s tour, we first presented the teams’ classification and final round using a relatively sophisticated visualization before gradually simplifying it using standard bar graphs.
Designs for graphics
We have utilized a wide range of graph formats, including bar charts, timelines, and nightingale-rose diagrams, to demonstrate the breadth and intricacy of the data. In order to swiftly update the data for bar charts throughout the World Cup, we used the Data wrapper.
We also created several visuals during the special, including:
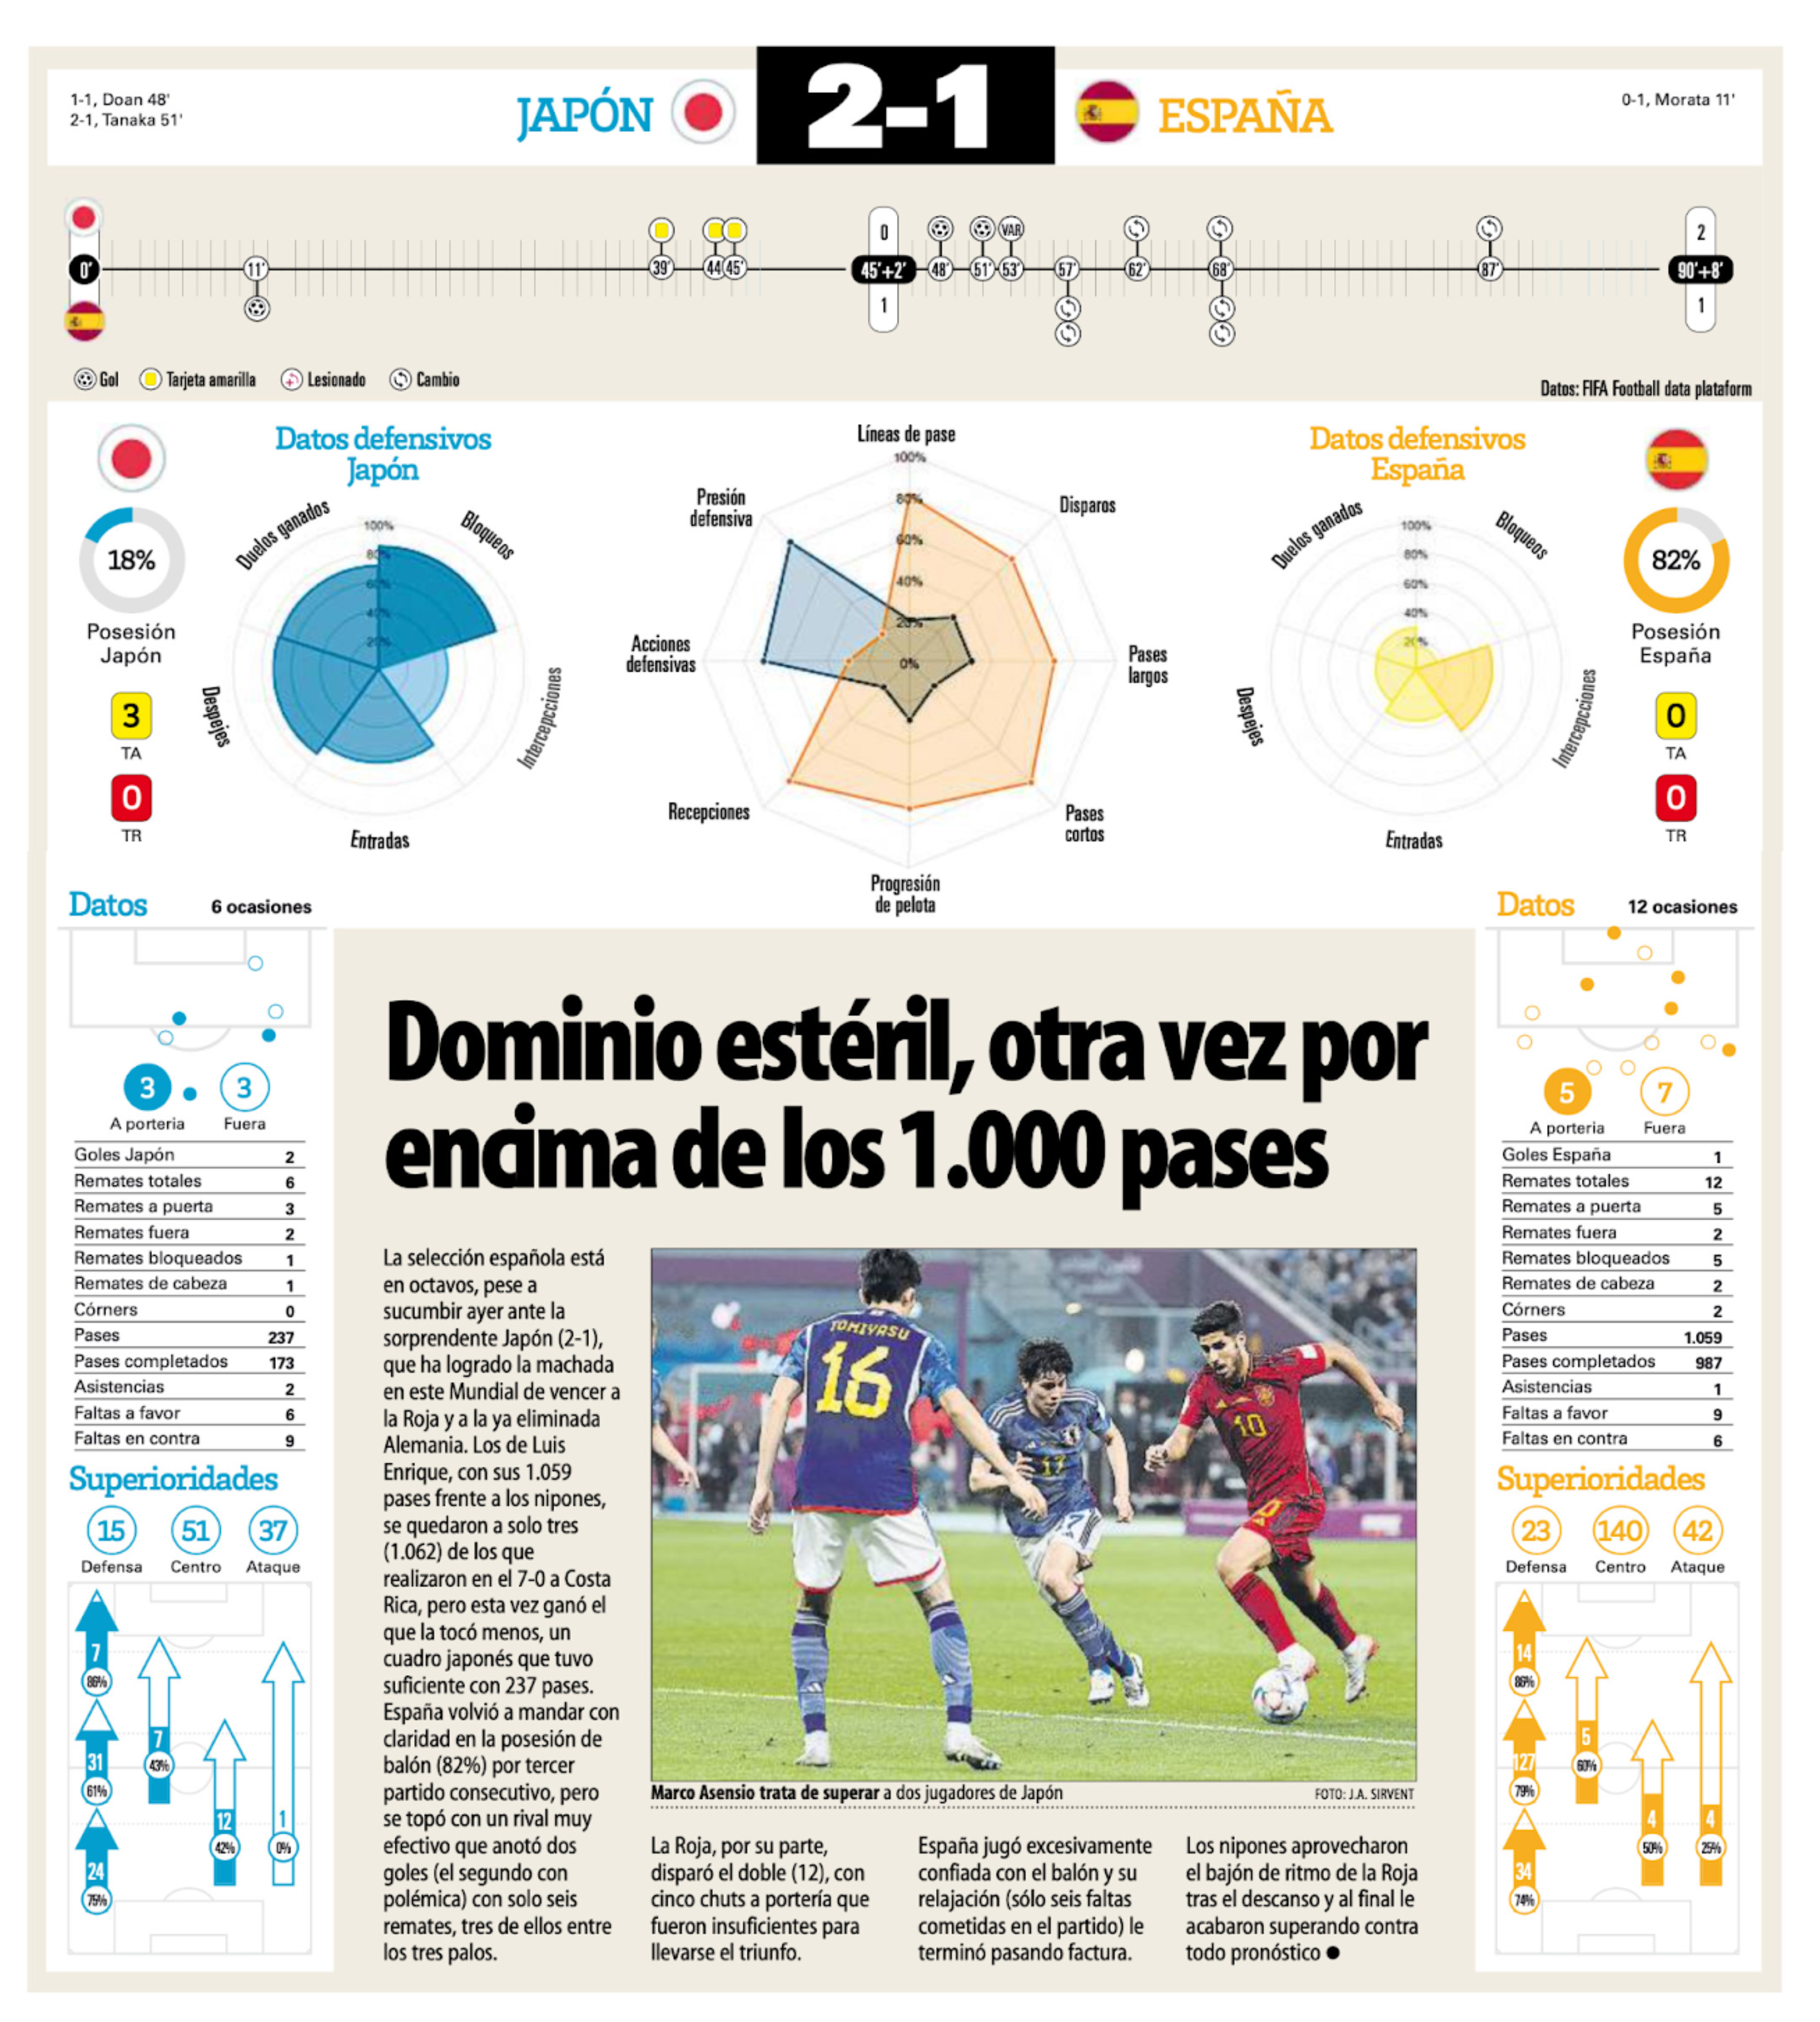
We display some of the most fascinating and important information from the national teams of Spain and its competitors. During the World Cup, we received all the information and graphs that we offered from the official FIFA website.
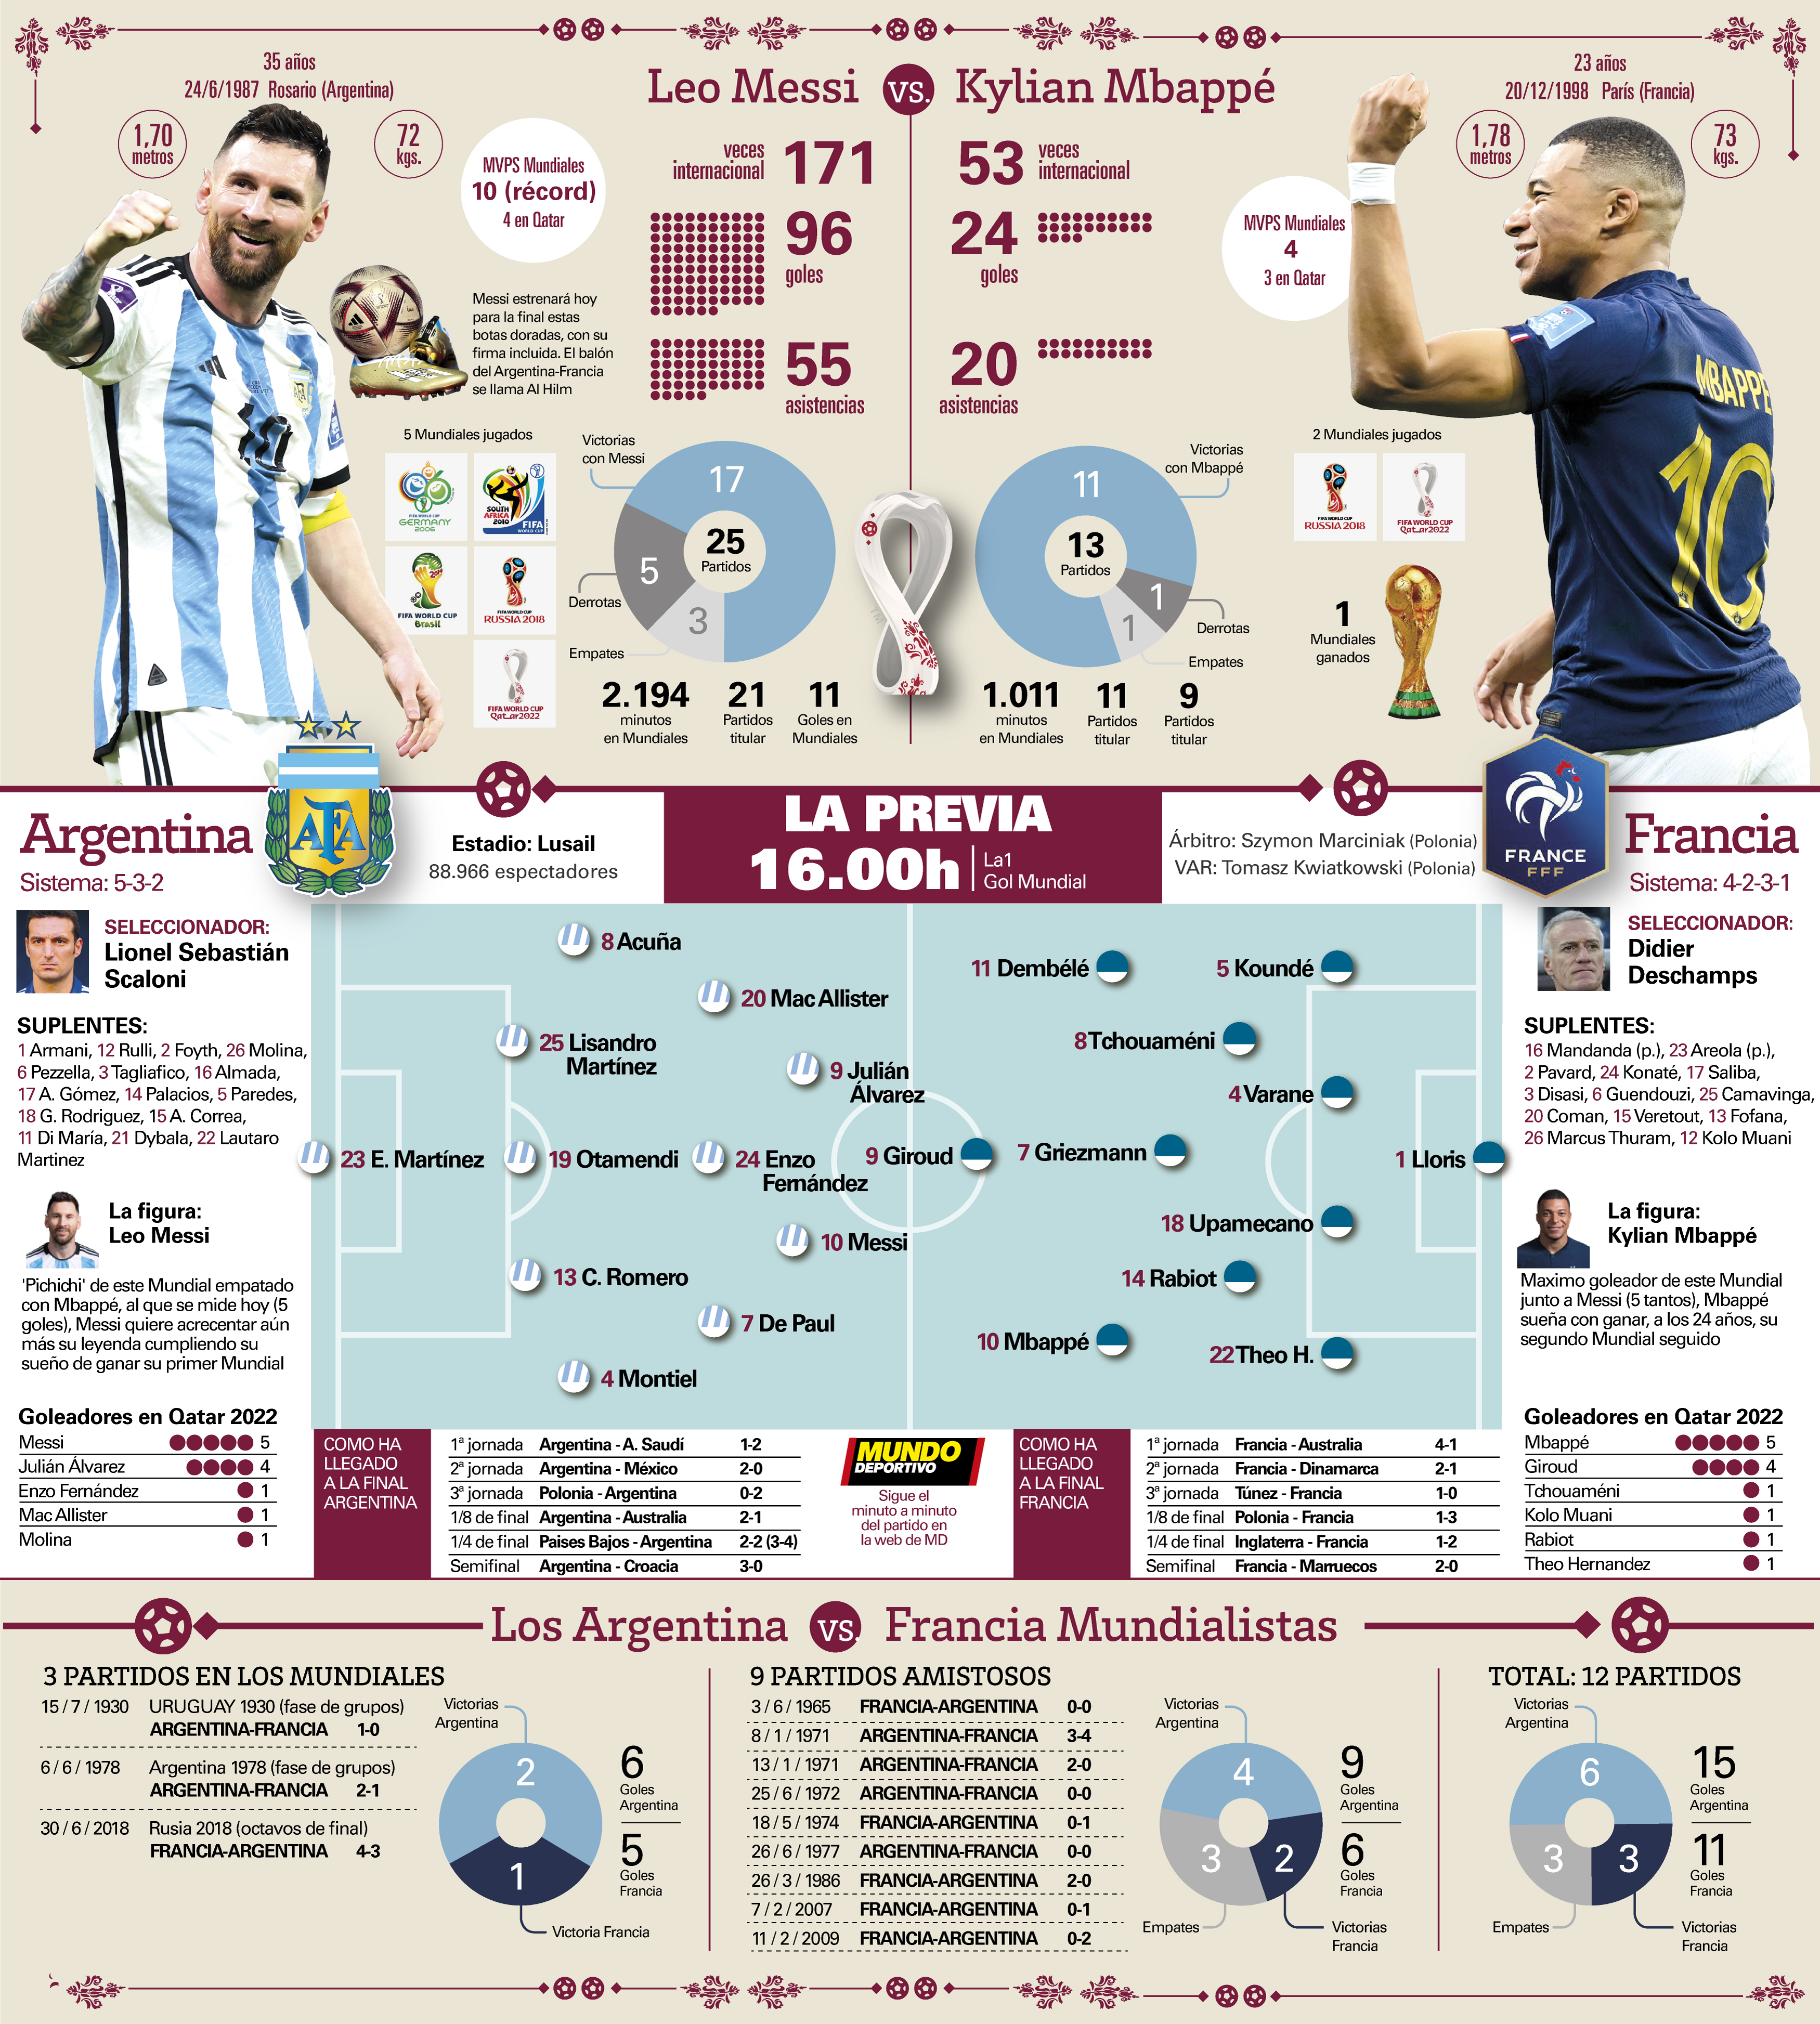
Final: Argentina vs. France
Final: Argentina vs. France
For the finals between France and Argentina, we created a page where we compared the statistics of Kylian Mbappé and Lionel Messi, the two stars of the tournament, in the upper part, the teams’ statistics in the middle and all of their match ups in the lower part.
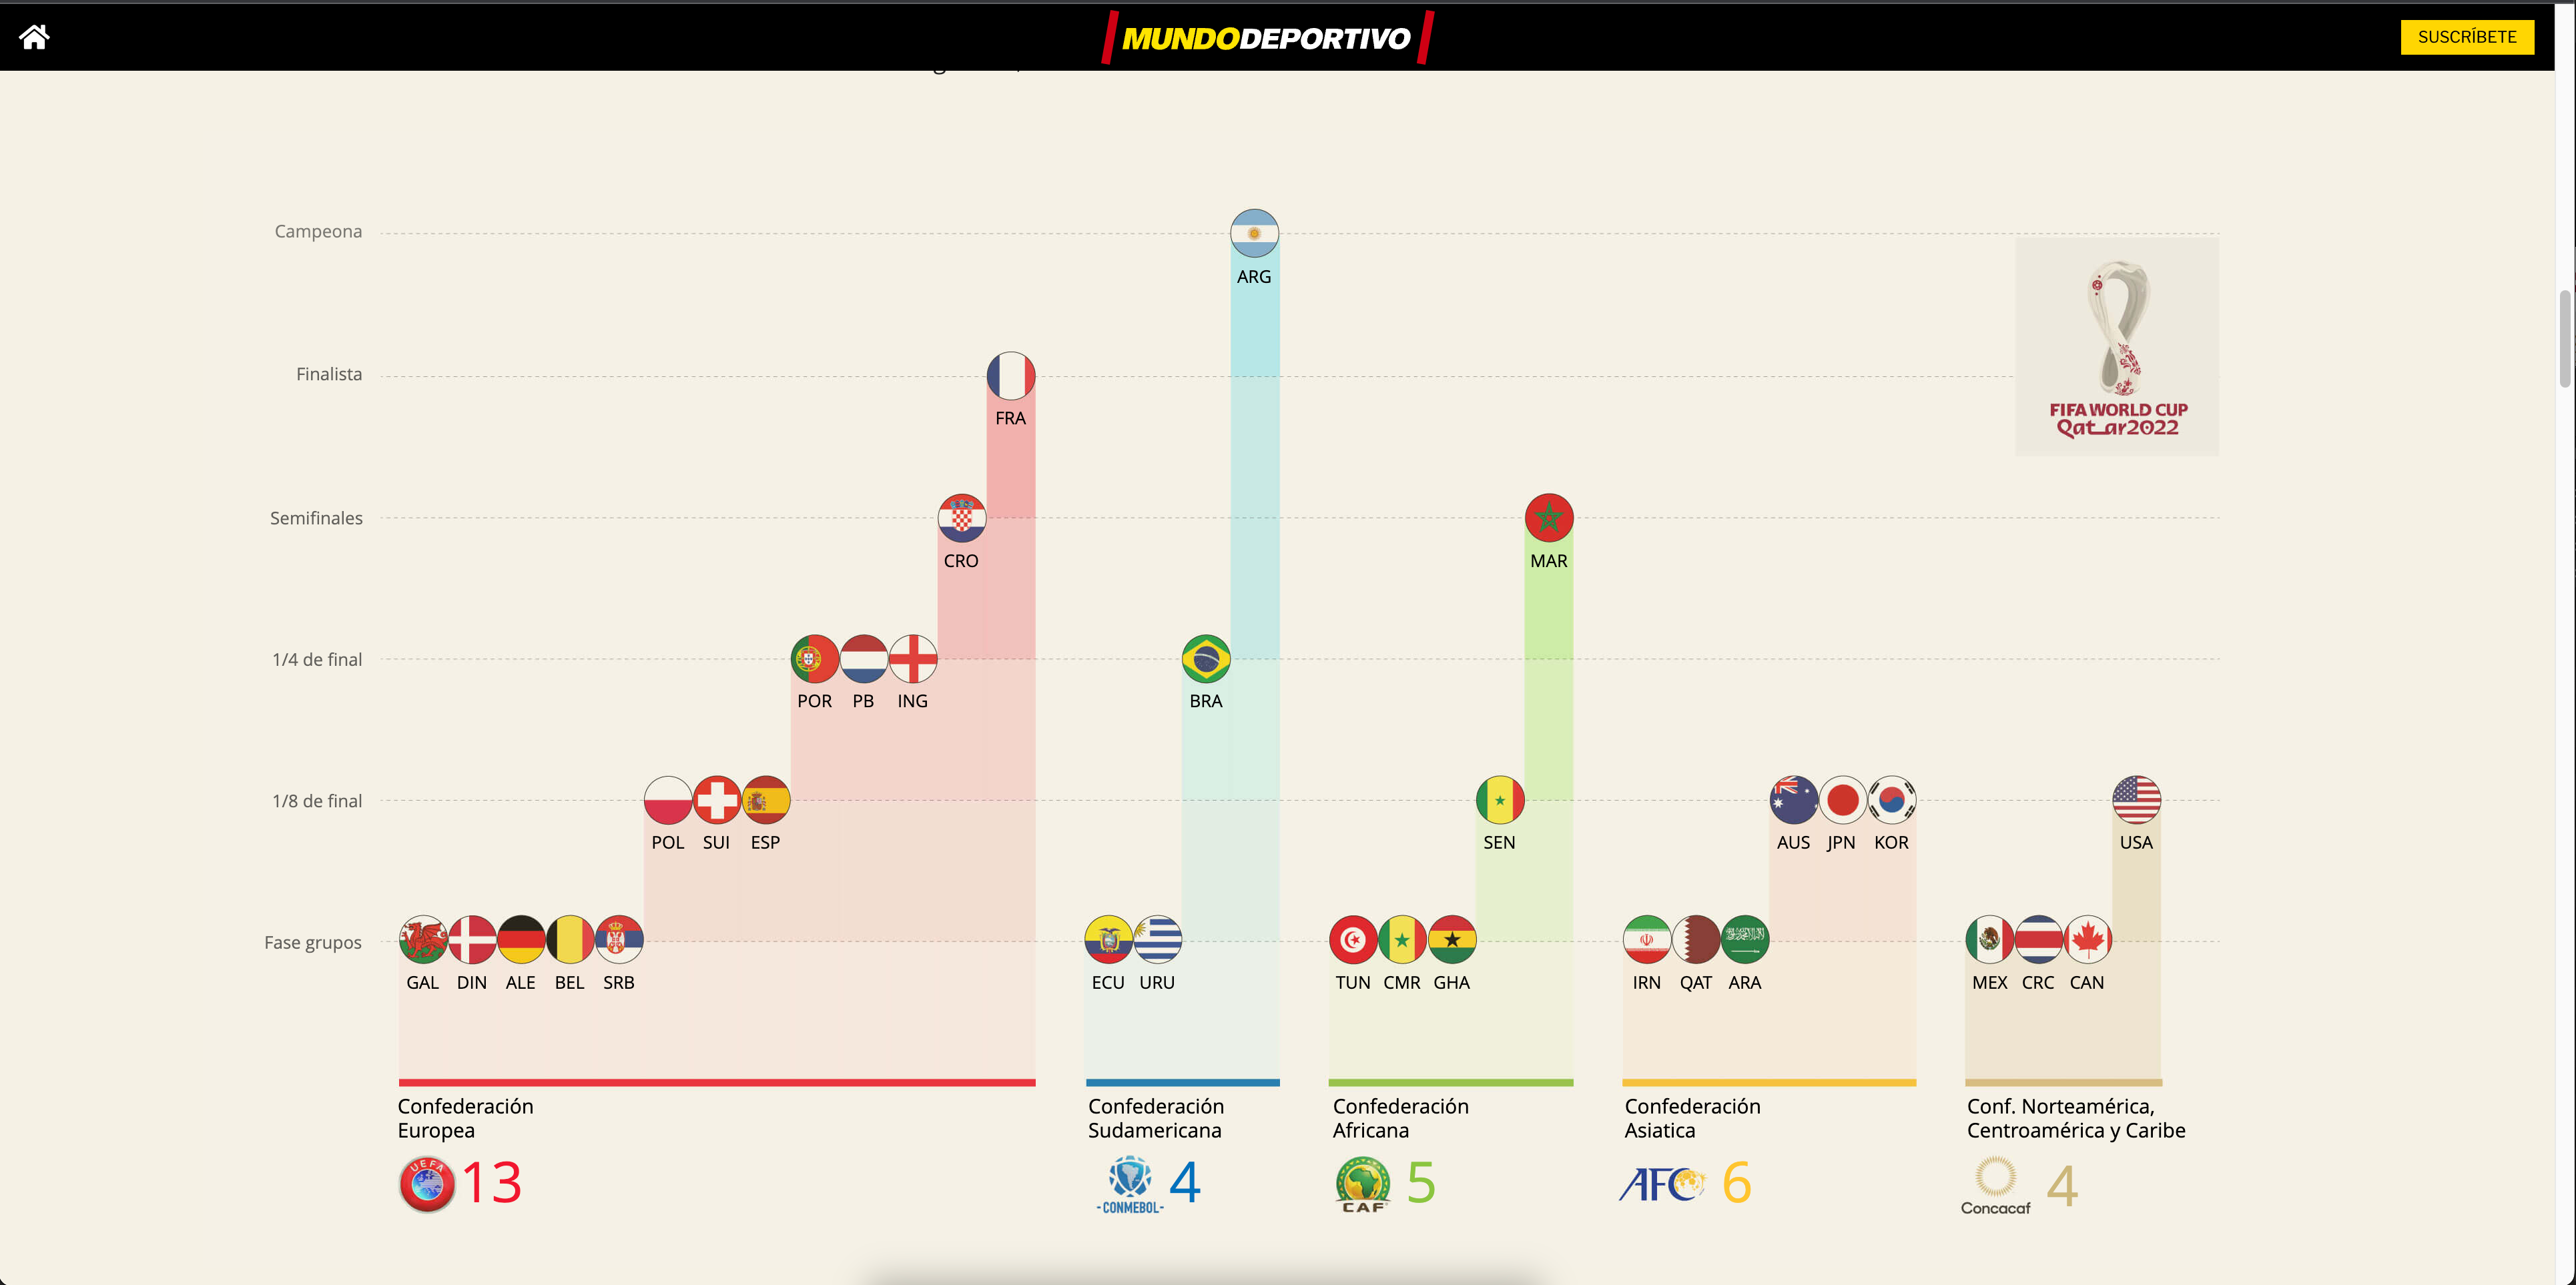
Confederations of soccer
Once the World Cup ended, we conducted a thorough analysis of the six previous World Cups, starting with the confederations’ World Cup in Japan in 2002 and ending with the most recent World Cup in Korea and Qatar in 2022.
After 20 years, UEFA’s dominance and that of the European teams, in soccer ‘s top event comes to an end with Argentina ‘s victory at the Qatar
2022 World Cup.
![]()